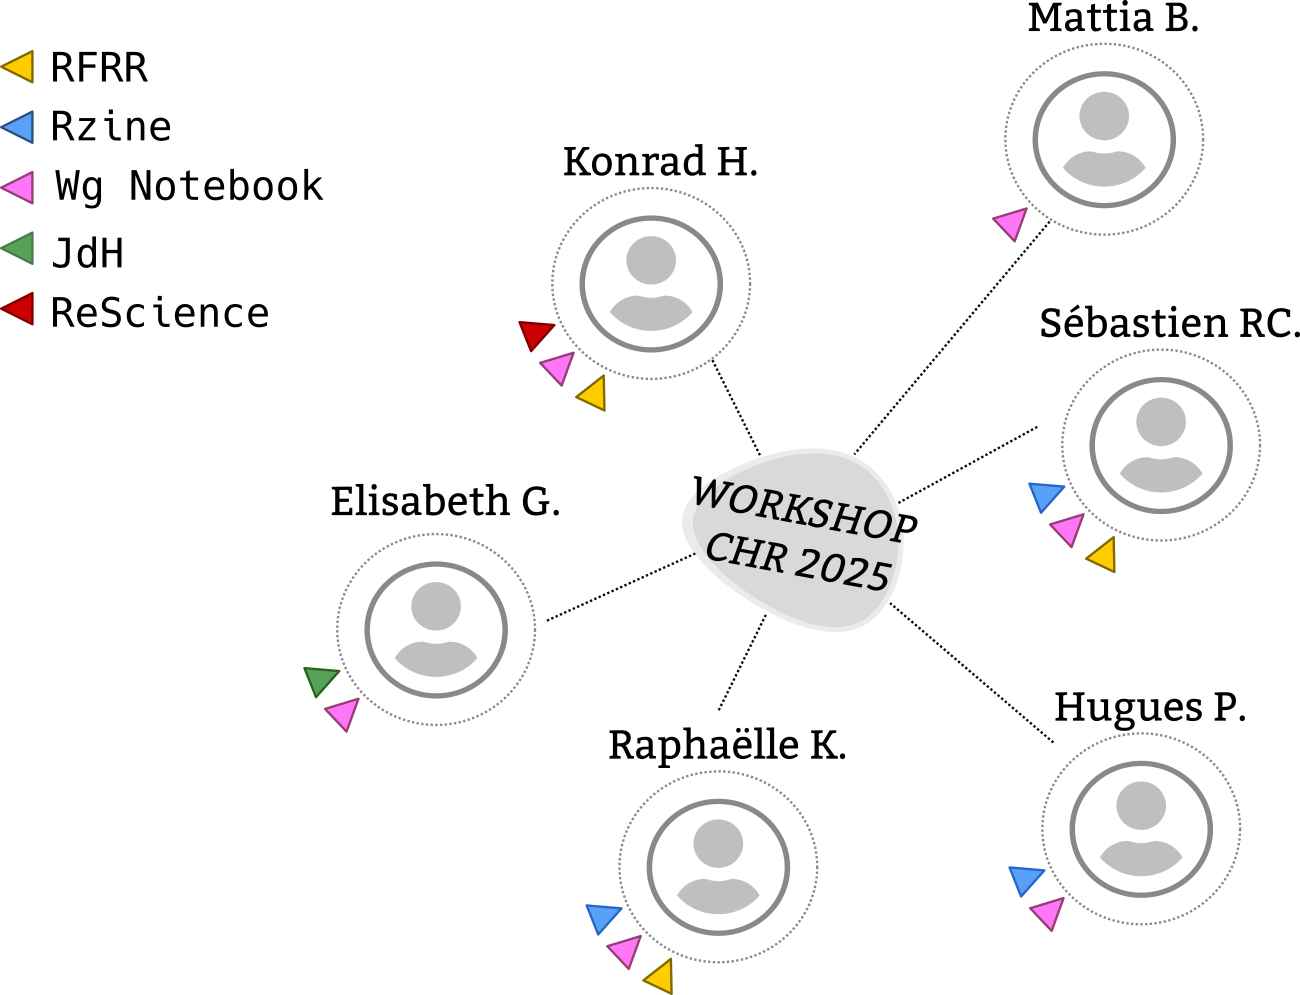
multidisciplinarity: geography and geomatics, philosophy of science and technology, biophysics, computer science, neuroscience, physics, knowledge engineering, etc.
open to all, no assigned roles
A policy to discuss in a kind and respectful manner (WIP)
Actions and experimentation freely organized by members
Not linked to specific institutions
Four themes
We study the complexity of the Notebook focusing on four themes:
Epistemology: practices and their context
Ecosophy: a reflective and critical engagement with digital practices
Digital literacies (re)-thinking scientific writing through the lens of machine and environment
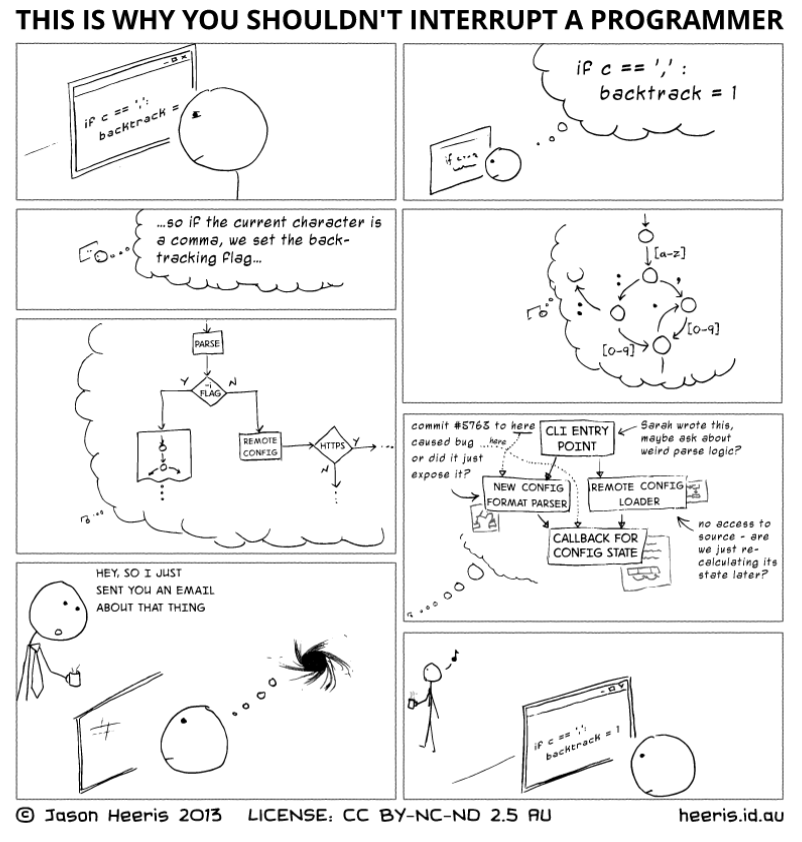
The first reaction is that this is a new, painful form of documentation.
It is not. Documentation is a how construct. It is a way of explaining how a program works or how an application interface should be used.
Literate programming is about why.[…]
The why becomes important when you have to maintain and modify a program. You can perfectly understand how a subroutine, module, or class works. You can explain its input and outputs. What you don’t understand is why it exists. Nobody writes that down. […]
interactive (e.g. Jupyter) vs. compiler-style (e.g. knitr)
tied to a language (e.g. Mathematica) vs. adaptable to any language (e.g. Jupyter)
one language per document (e.g. Jupyter) vs. multiple (e.g. Emacs/org-babel)
focus on recording a computation (e.g. Jupyter) vs. publishing (e.g. Quarto)
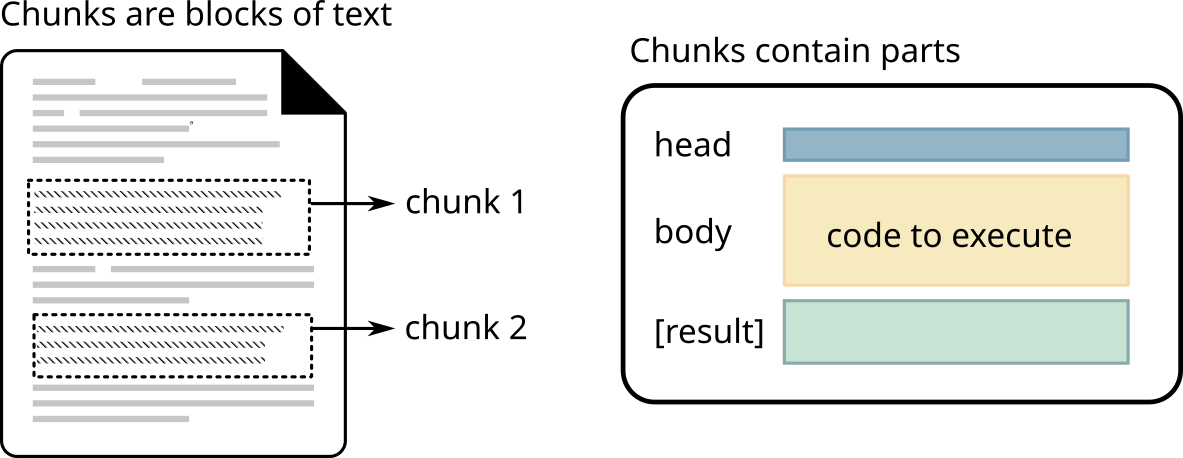
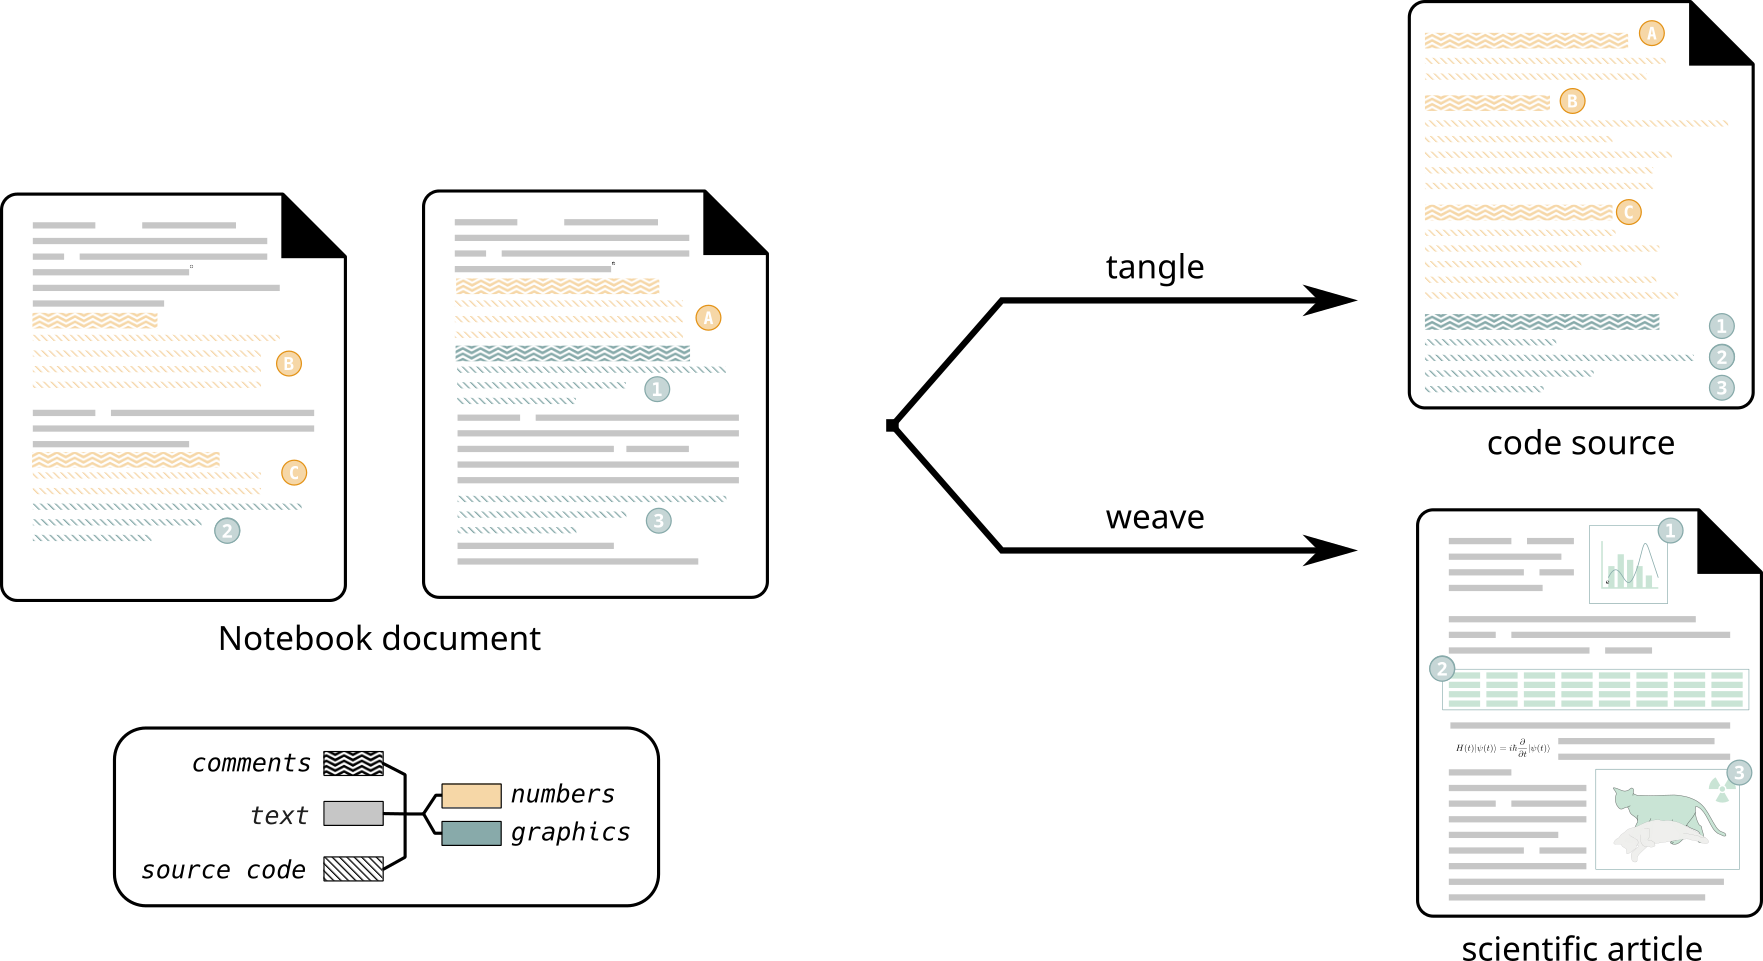
One same big concept is shared by all of them.
One Word
One Word
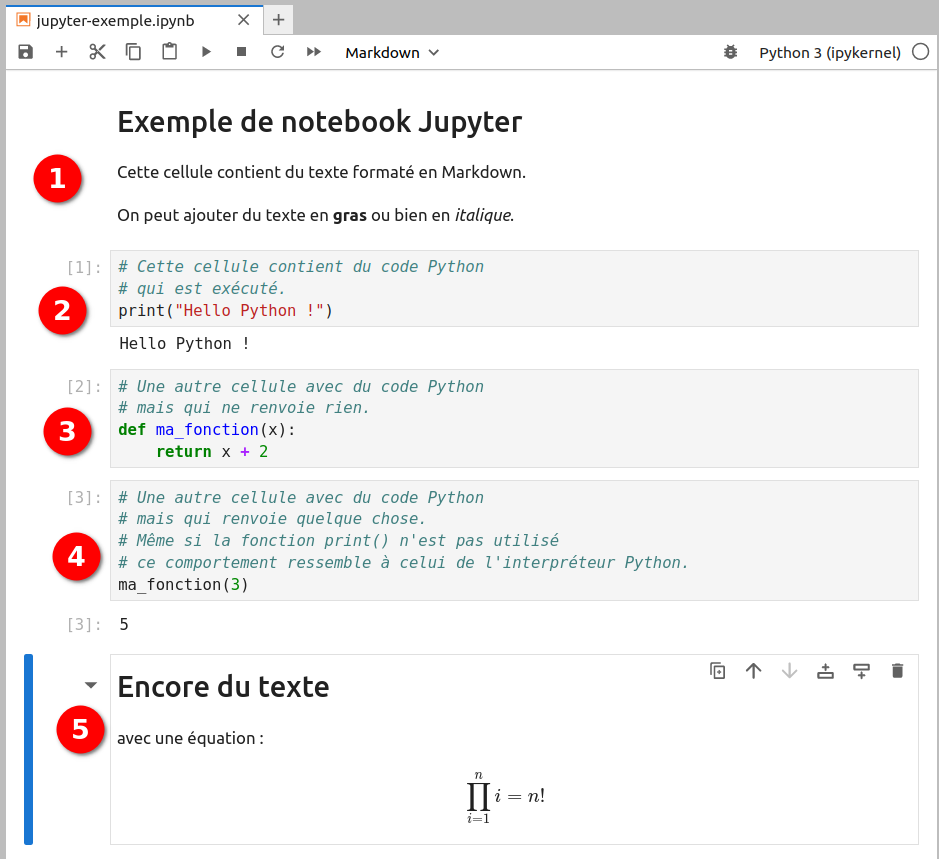
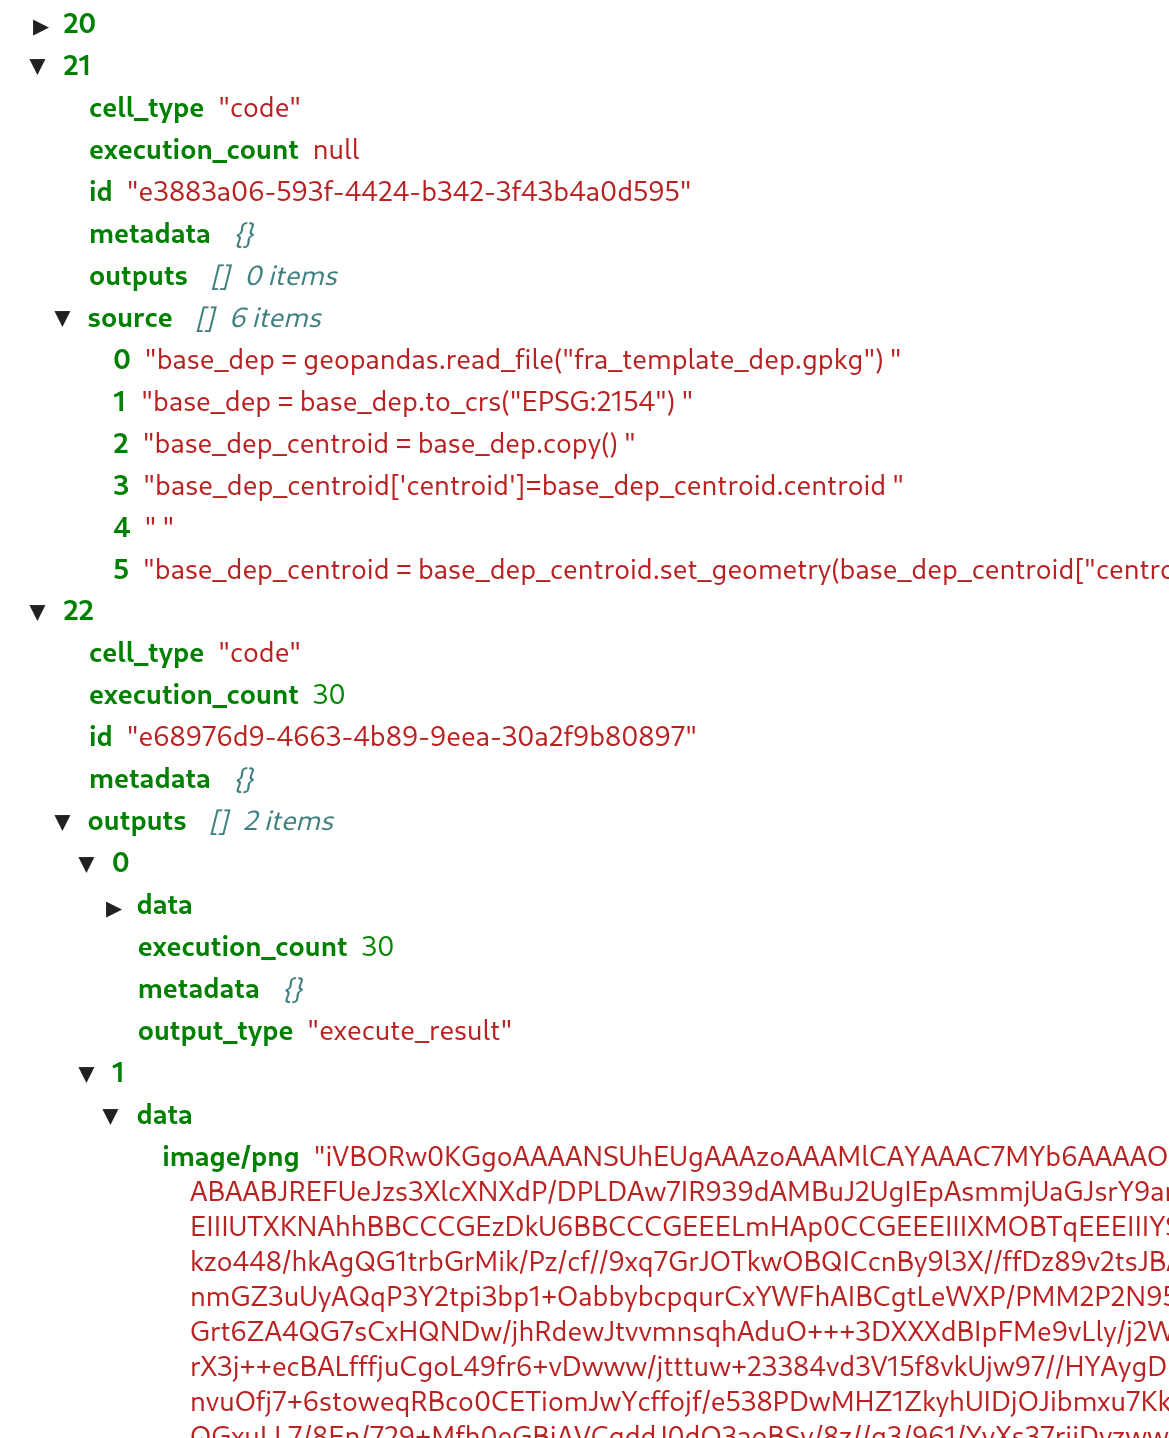
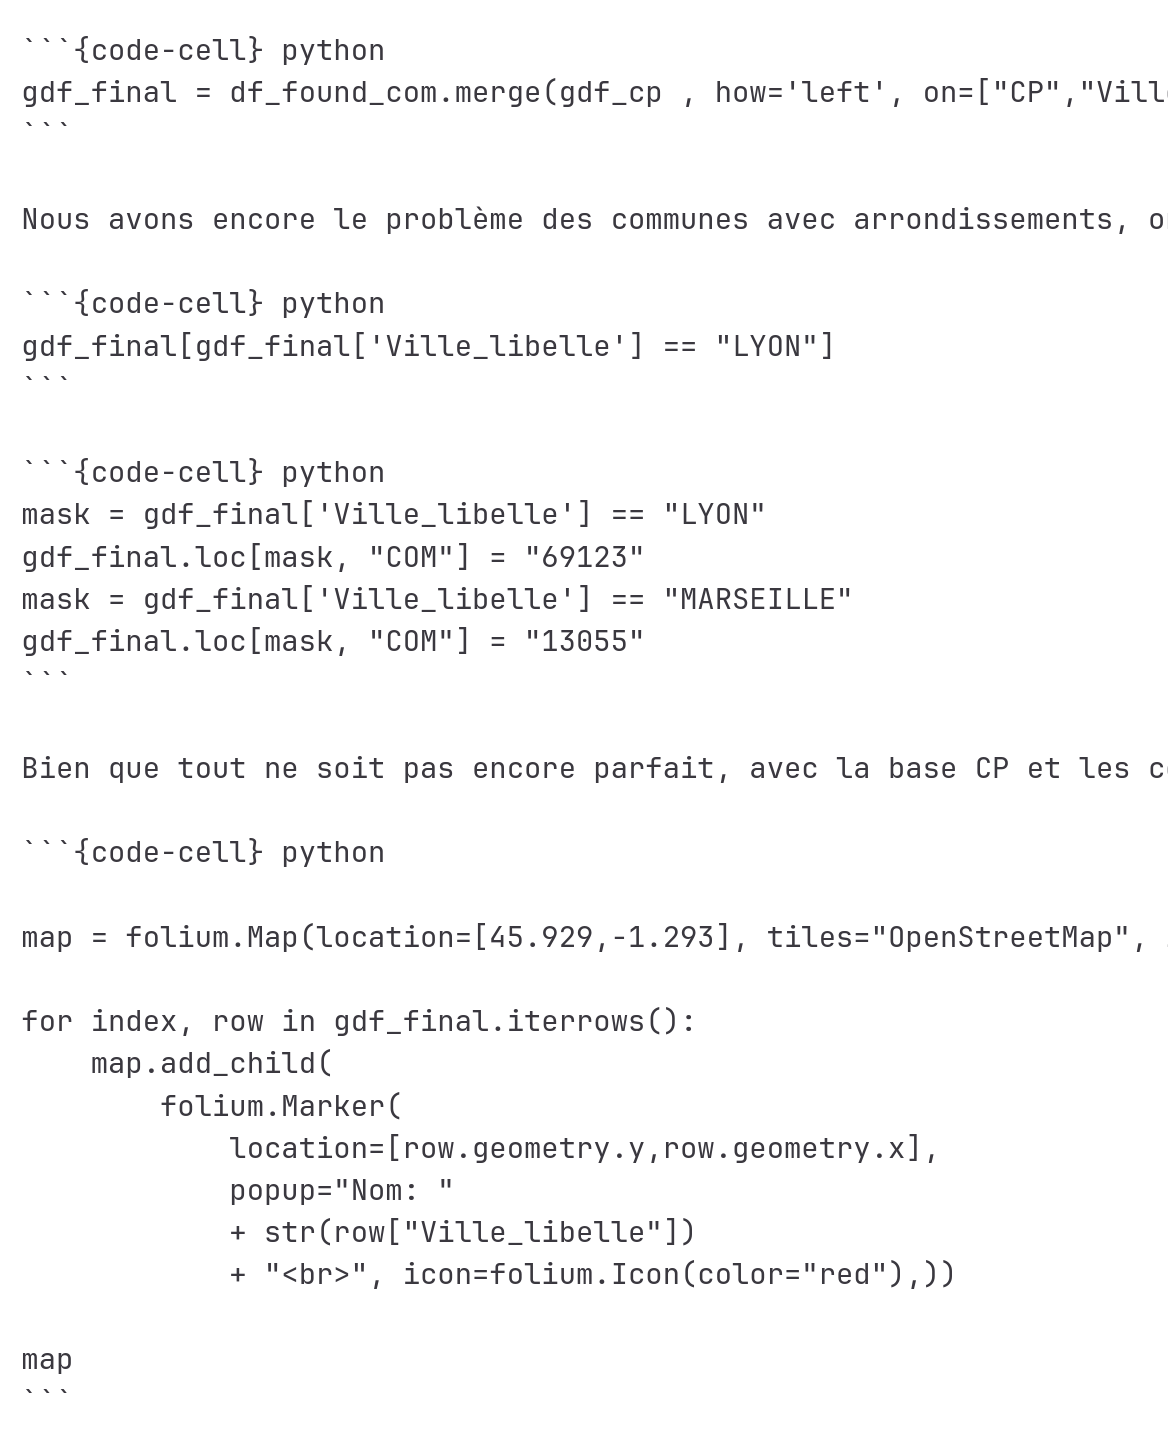
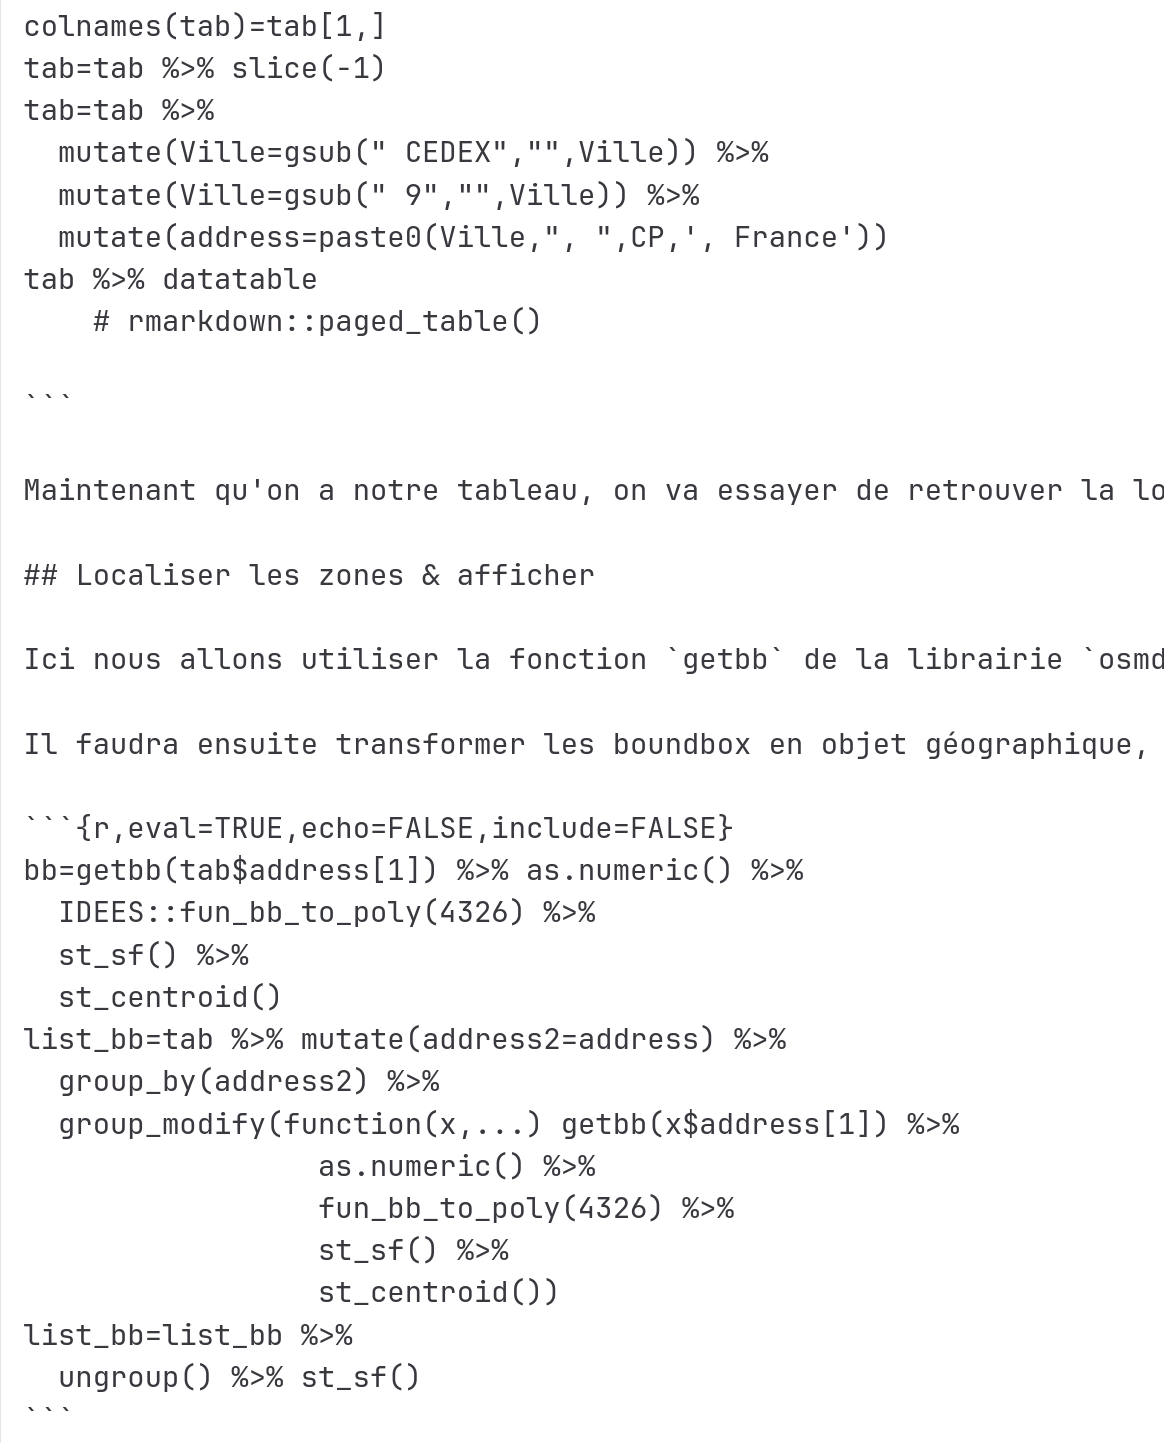
Example: Jupyter
Exemple extracted from https://python.sdv.u-paris.fr/ courses
Limitations of notebooks
Data Science boom: “cambrian explosion” of both tools and features
But…
One notebook = one computation = one story
Hard to combine or reuse
Insufficient for explaining complex algorithms
Spatial thinking ?
Challenging reproducibility
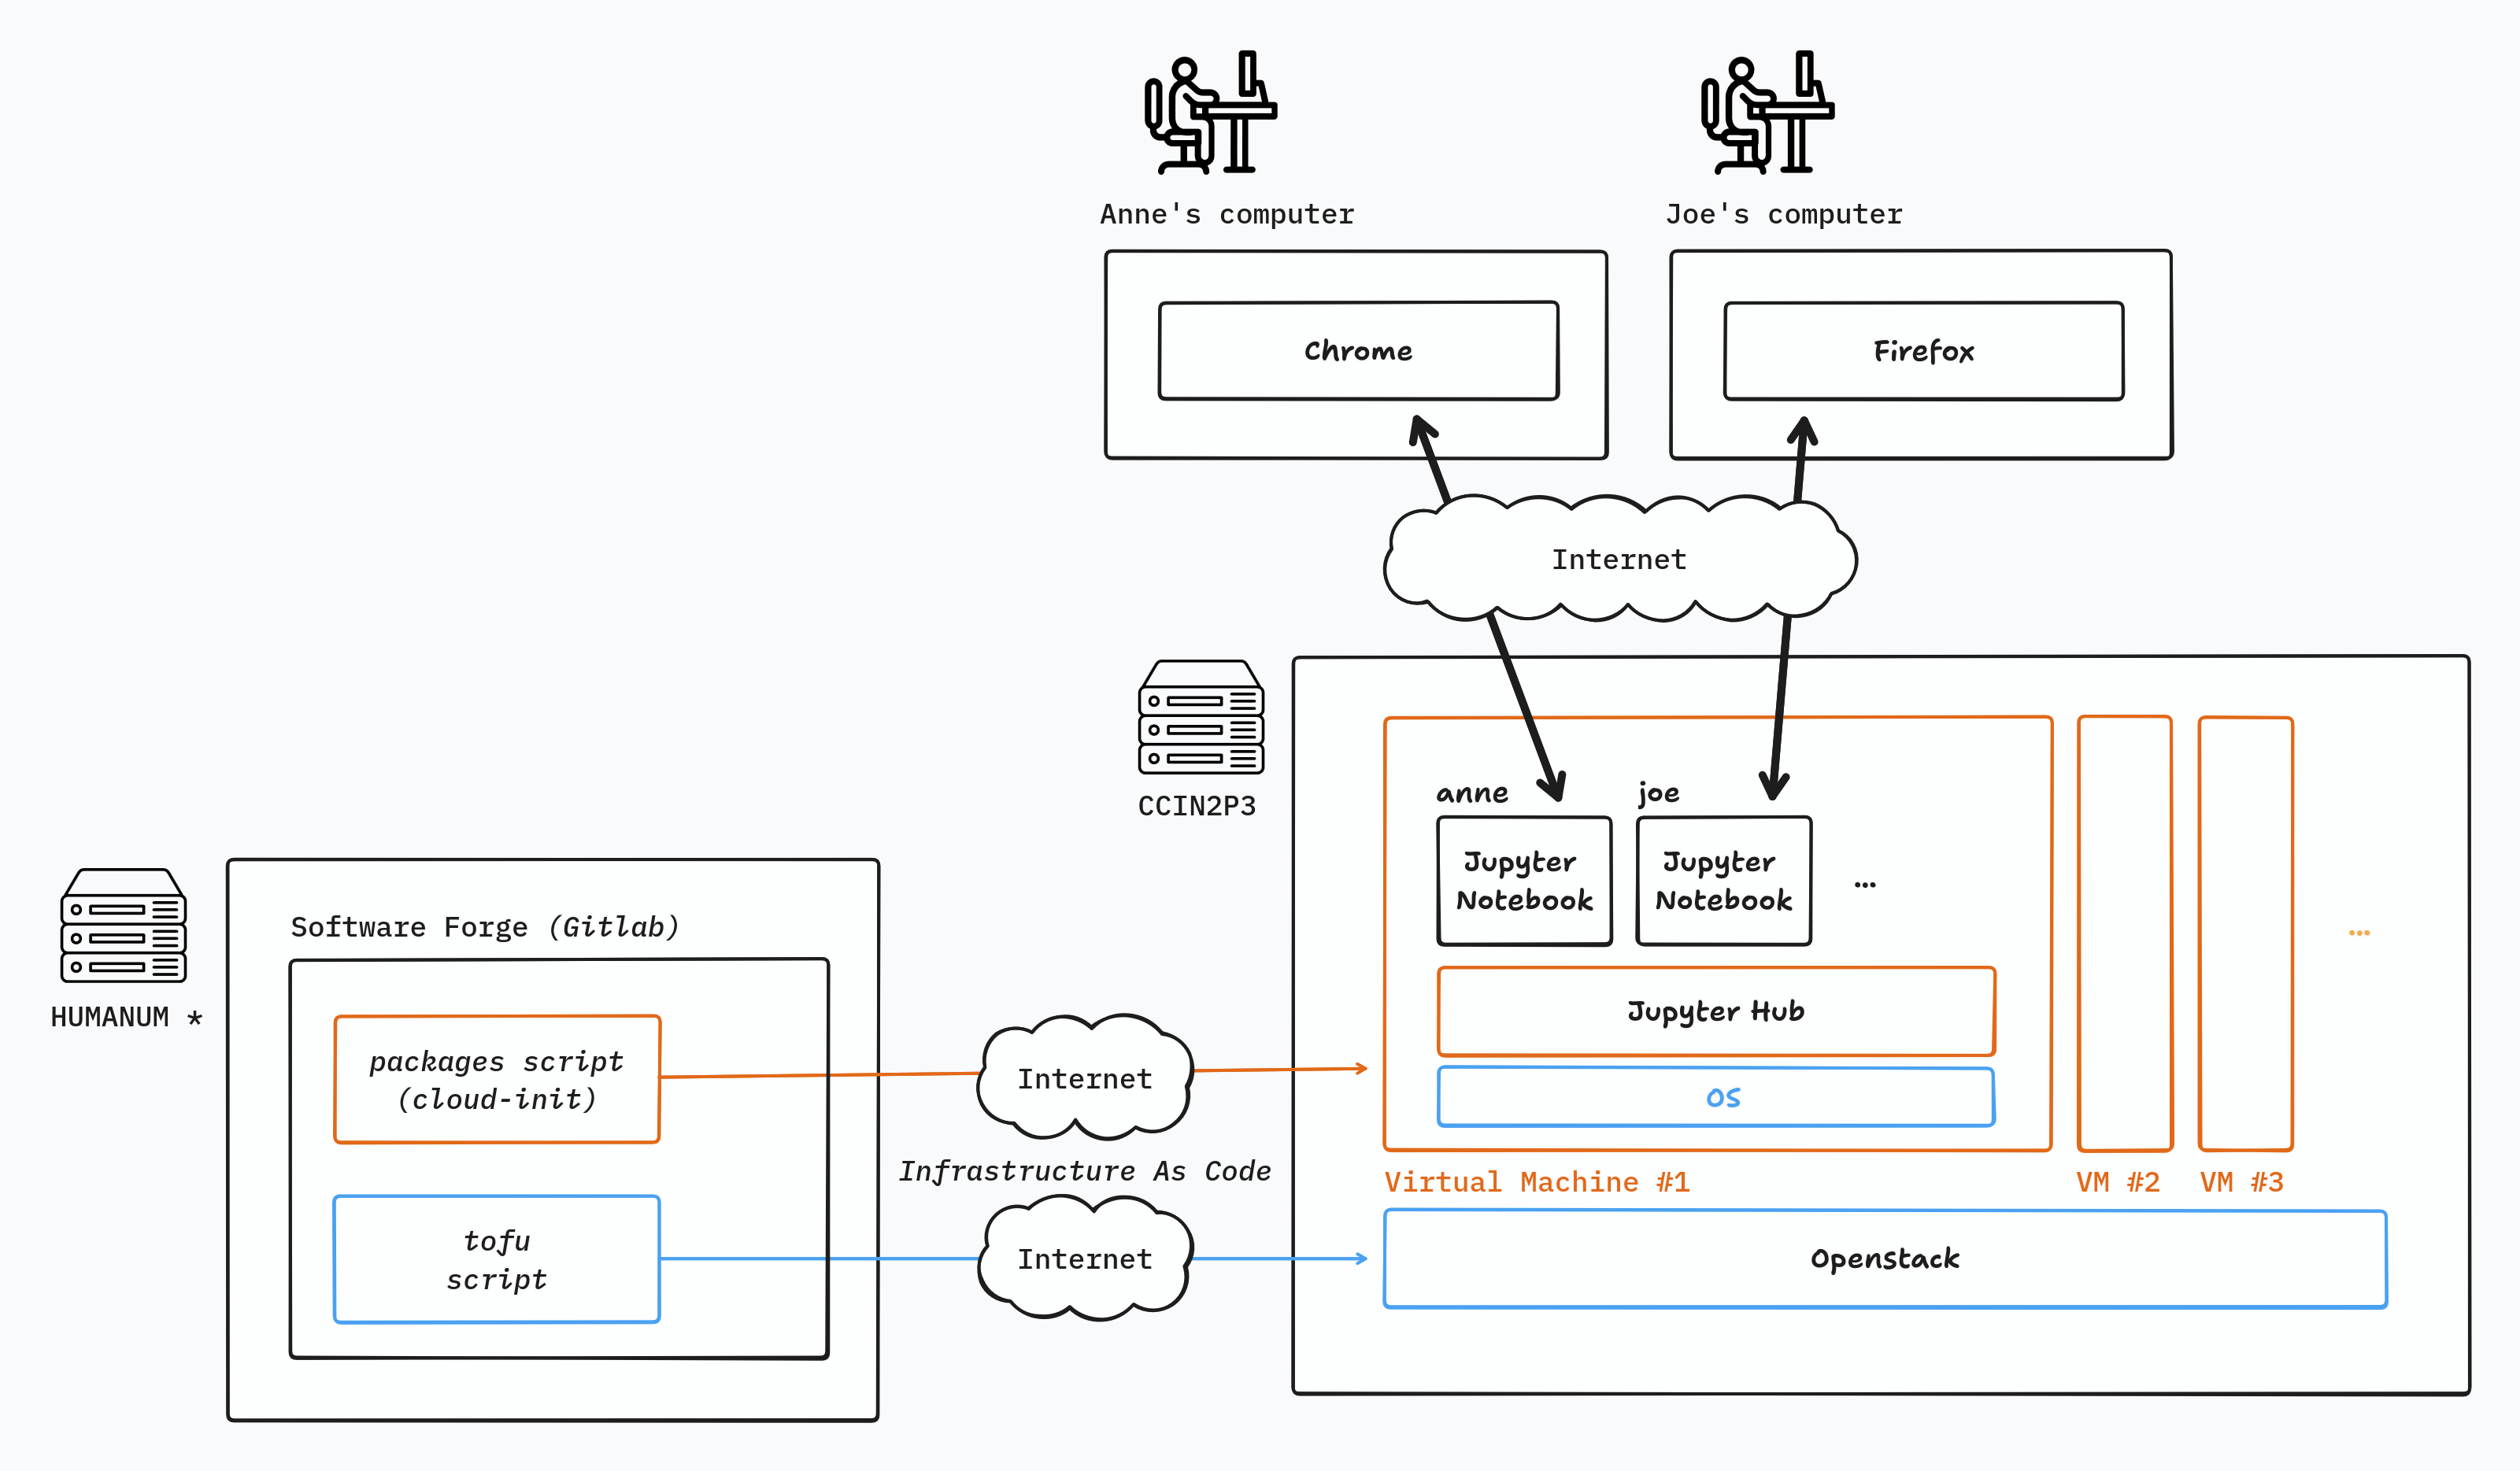
A complex architecture for delivering JupyterNotebook during the workshop
Challenging reproducibility
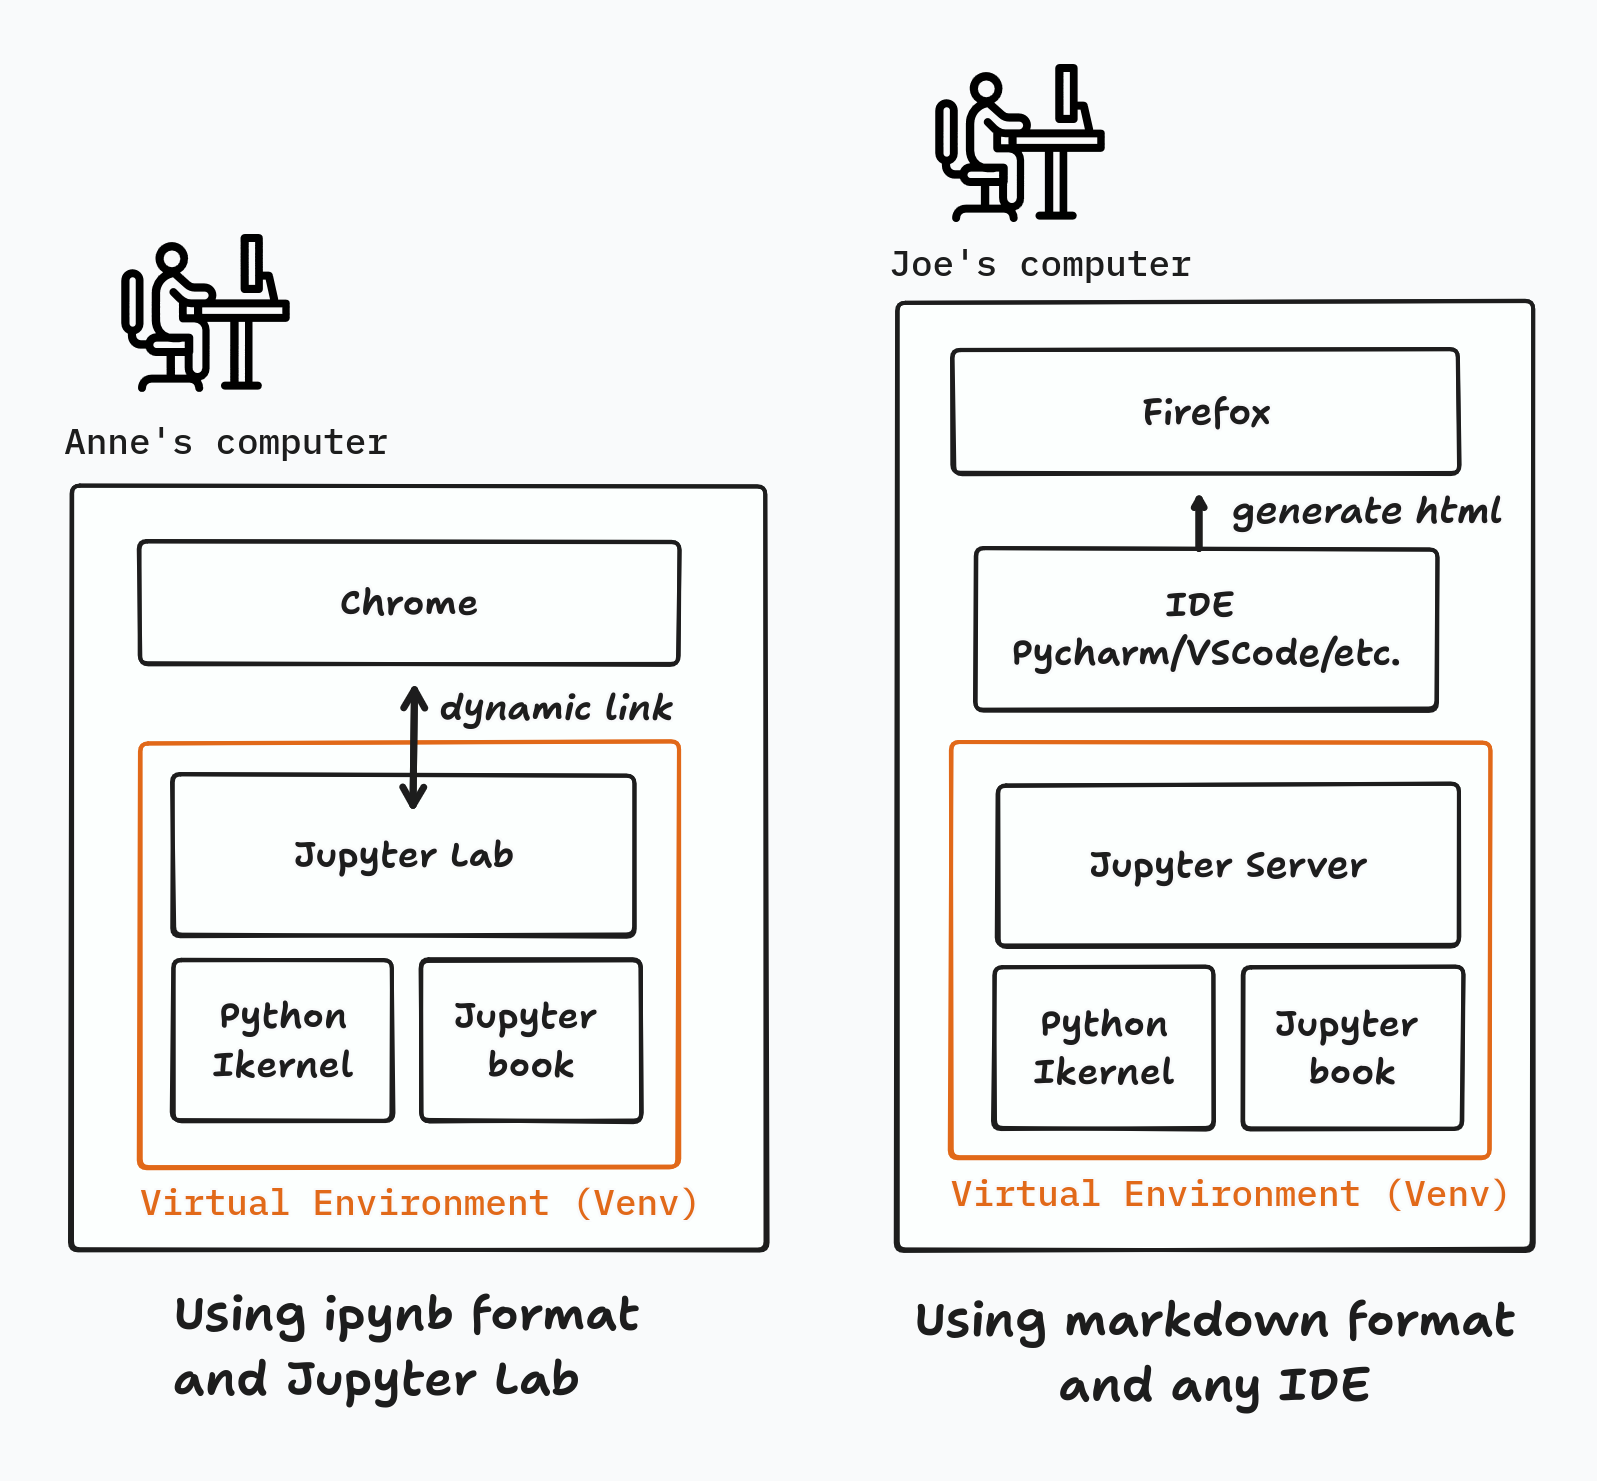
Reproducibility at home: Linux, Windows or Mac :)
Please try following our (WIP) tutorial for Windows or Linux
Reproducibility and replicability
Reproducing: re-running a simulation or data analysis identically
be sure what was done exactly
establishing a baseline for experimentation
Replicating: replacing pieces of code and/or data by something believed to be equivalent
testing methods, code, and data for robustness
challenge your beliefs about equivalence
Perspectives on data and code
Research perspective
Data is about the world we study
Data is collected, curated, cleaned, … by scientists
Computation makes output data from input data
My input data is someone else’s output data (and vice versa)
Code is a tool
Computational perspective
Any bit pattern is data
Code is data
Code defines the meaning of data (within a computation)
Documenting provenance
Three kinds of data:
Recorded observations: record with metadata about provenance
Choices made by humans: keep under version control
Computed results: record inputs (with their provenance)
Apply these rules and enjoy computational reproducibility!
From theory to practice
Some datasets are too big to be fully archived and versioned
Much data (in particular code) is proprietary
Different kinds of data are often entangled
Almost all our software pre-dates reproducibility concerns
The software industry doesn’t care much about reproducibility
Issues we will encounter in the workshop
Databases on the Internet are out of our control
Software environments are hard to make reproducible
Data & Knowledge Graphs (How ?)
Our focus : research data rather than data science, and “capta” rather than “given data”
As digital humanists have adopted visualization tools in their work, they have borrowed methods developed for the graphical display of information in the natural and social sciences. These tools carry with them assumptions of knowledge as observer-independent and certain, rather than observer co-dependent and interpretative. (…) we need a humanities approach to the graphical expression of interpretation. To begin, the concept of data as a given has to be rethought through a humanistic lens and characterized as capta, taken and constructed. Next, the forms for graphical expression of capta need to be more nuanced to show ambiguity and complexity. Finally, the use of a humanistic approach, rooted in a co-dependent relation between observer and experience, needs to be expressed according to graphics built from interpretative models. In summary: all data have to be understood as capta and the conventions created to express observer-independent models of knowledge need to be radically reworked to express humanistic interpretation. (Drucker (2011))
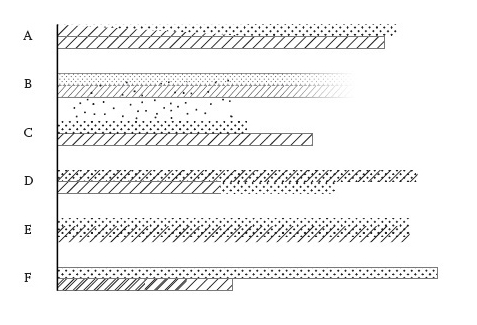
Data & Knowledge Graphs (How ?)
In this chart gendered identity is modified. In nation A, the top bar contains a changing gradient, indicating that “man” is a continuum from male enfant to adult, or in countries E and D, that gender ambiguity is a factor of genetic mutation or adaptation, thus showing that basis on which gendered individuals are identified and counted is complicated by many factors. In country F women only register as individuals after coming of reproductive age, thus showing that quantity is a effect of cultural conditions, not a self-evident fact. The movement of men back and forth across the border of nations B and C makes the “nations” unstable entities. Graphic credit Xárene Eskandar. Figure 2 in (Drucker (2011))
Data & Knowledge Graphs (How ?)
Reflexivity posture within spy glass telescope imagery
Data & Knowledge Graphs (How ?)
facing scientific information and knowledge strengths & weaknessess in a world of growing dis-informations
connecting open research data within knowledge graphs (Linked Open Data)
semantic web (knowledge representation)
ontologies
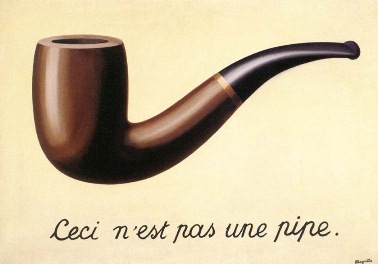
Ceci n’est pas une pipe, The Treachery of Images René Magritte, 1929
Data & Knowledge Graphs (How ?)
Within knowledge engineering framework (Davis, Shrobe, et Szolovits (1993)), a knowledge representation is
a substitute
a set of ontological commitments
a fragmented theory of intelligent reasoning
a means for efficient calculation
a tool for human communication
Data & Knowledge Graphs (How ?)
building a shared exploration methodology of research data: definition of an data model with ontological and semantic conmitments
An ontology is a formal, explicit specification of a shared conceptualization. (Studer, Benjamins, et Fensel (1998))
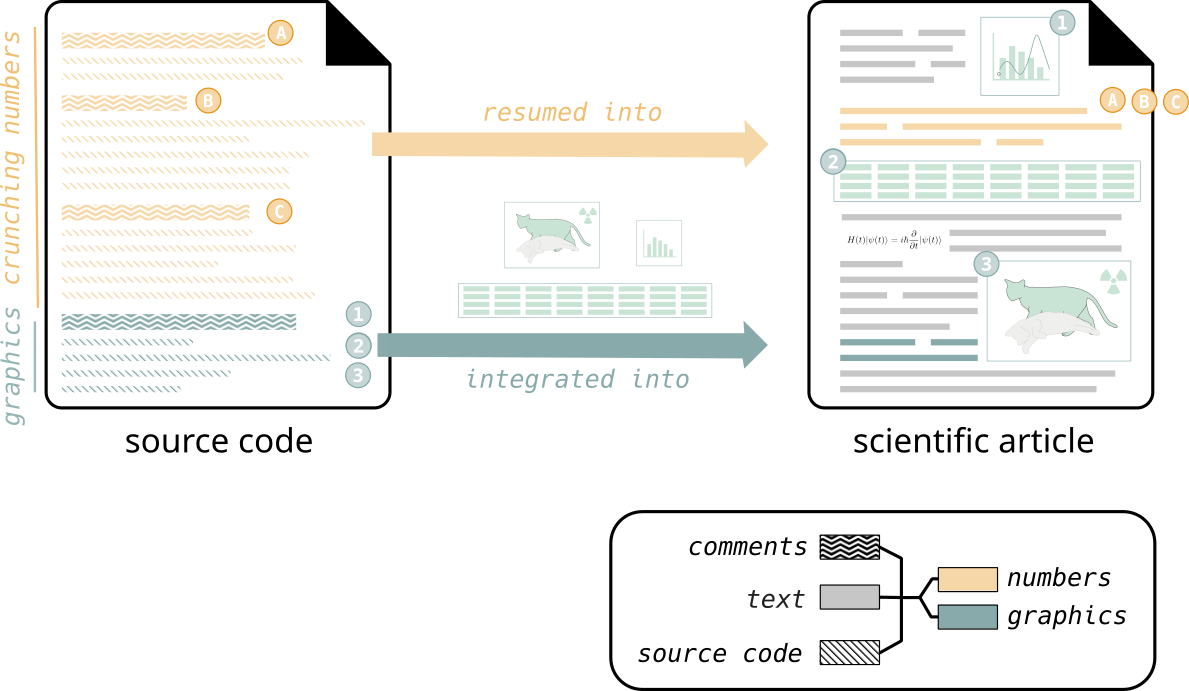
eliciting a work-in-progress literate programming paradigm in producing computed research data: computational commitments
Data, KG and questions adressed (How ?)
in an open science world : how to contribute to a 21st encyclopedic project ?
within constraints relative to collective scientific data/capta collection and computation with externalities : how to adress research questions (finding index, proofs, replicability of computation, reviews etc.)
we propose no closed tool or push buttons, but more likely some way of producing “hand-made” instruments as a reading of Husserl (Nunes (2005)) might have defined them
Workshop: short presentation
Editorialization
Within what french researchers Emmanuel Souchier and Yves Jeanneret (Souchier et Jeanneret (2005)) called “Les écrits d’écran”, one should refer to Georges Perec’s “infra-ordinaire” so to care about the complexe reality and depth of computer interfaces and materiality of technologies involved as well as actors contributing to the digital production or edition of knowledge.
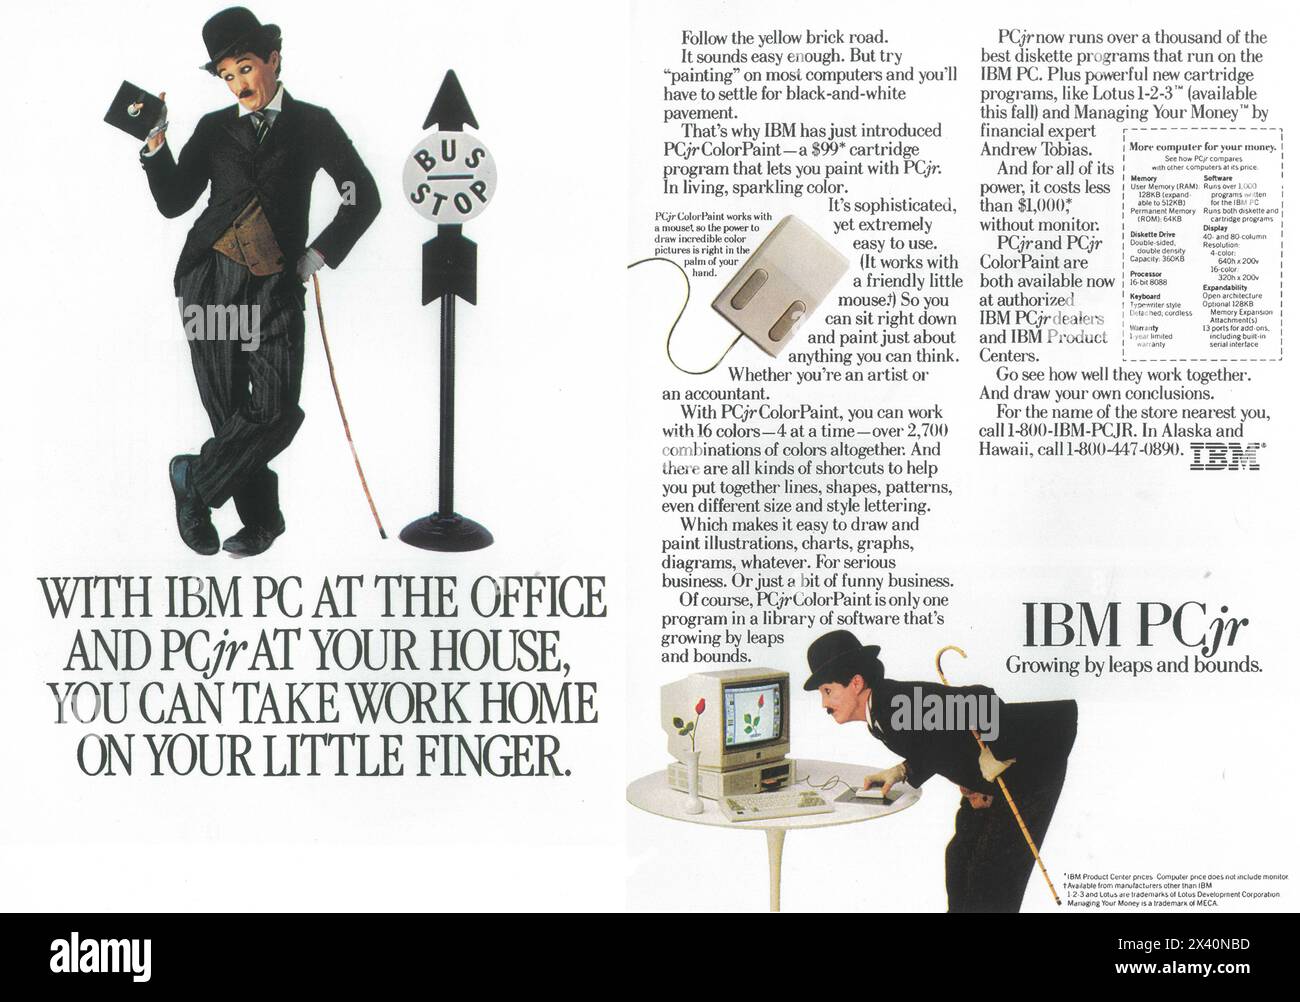
Bus advertising 1980s
Editorialization
The central idea (…) is that the fine indexing of content made possible by digital technology introduces a new relationship with content and documents. Whereas traditional indexing focuses on finding the document or documents containing the information being sought, fine-grained content indexing makes it possible to find only the segments relevant to the information search and to configure the use of these segments. (…) These segments become resources and are reused to produce other content, of which they form the components. The goal is no longer to find documents, but to produce new ones using the resources found. This marks a shift from indexing for search purposes to indexing for publication purposes. As the latter is carried out according to rules and standards, we refer to it as editorialisation, to emphasise the fact that the indexed segments are used in editorial processes for new publications. (Bachimont 2007)
Editorialization
More than just a neologism coined to mark the transition to digital, the concept of editorialisation responds to issues raised by this new (digital) model. It is indeed essential to emphasise (…) how much the notion of editorialisation can change the way we inhabit digital space. Because it highlights its structure, editorialisation enables us to understand the digital space and the meaning of our actions within it: it reveals the relationships between objects, dynamics, forces, power mechanisms and sources of authority. (Vitali-Rosati 2016)
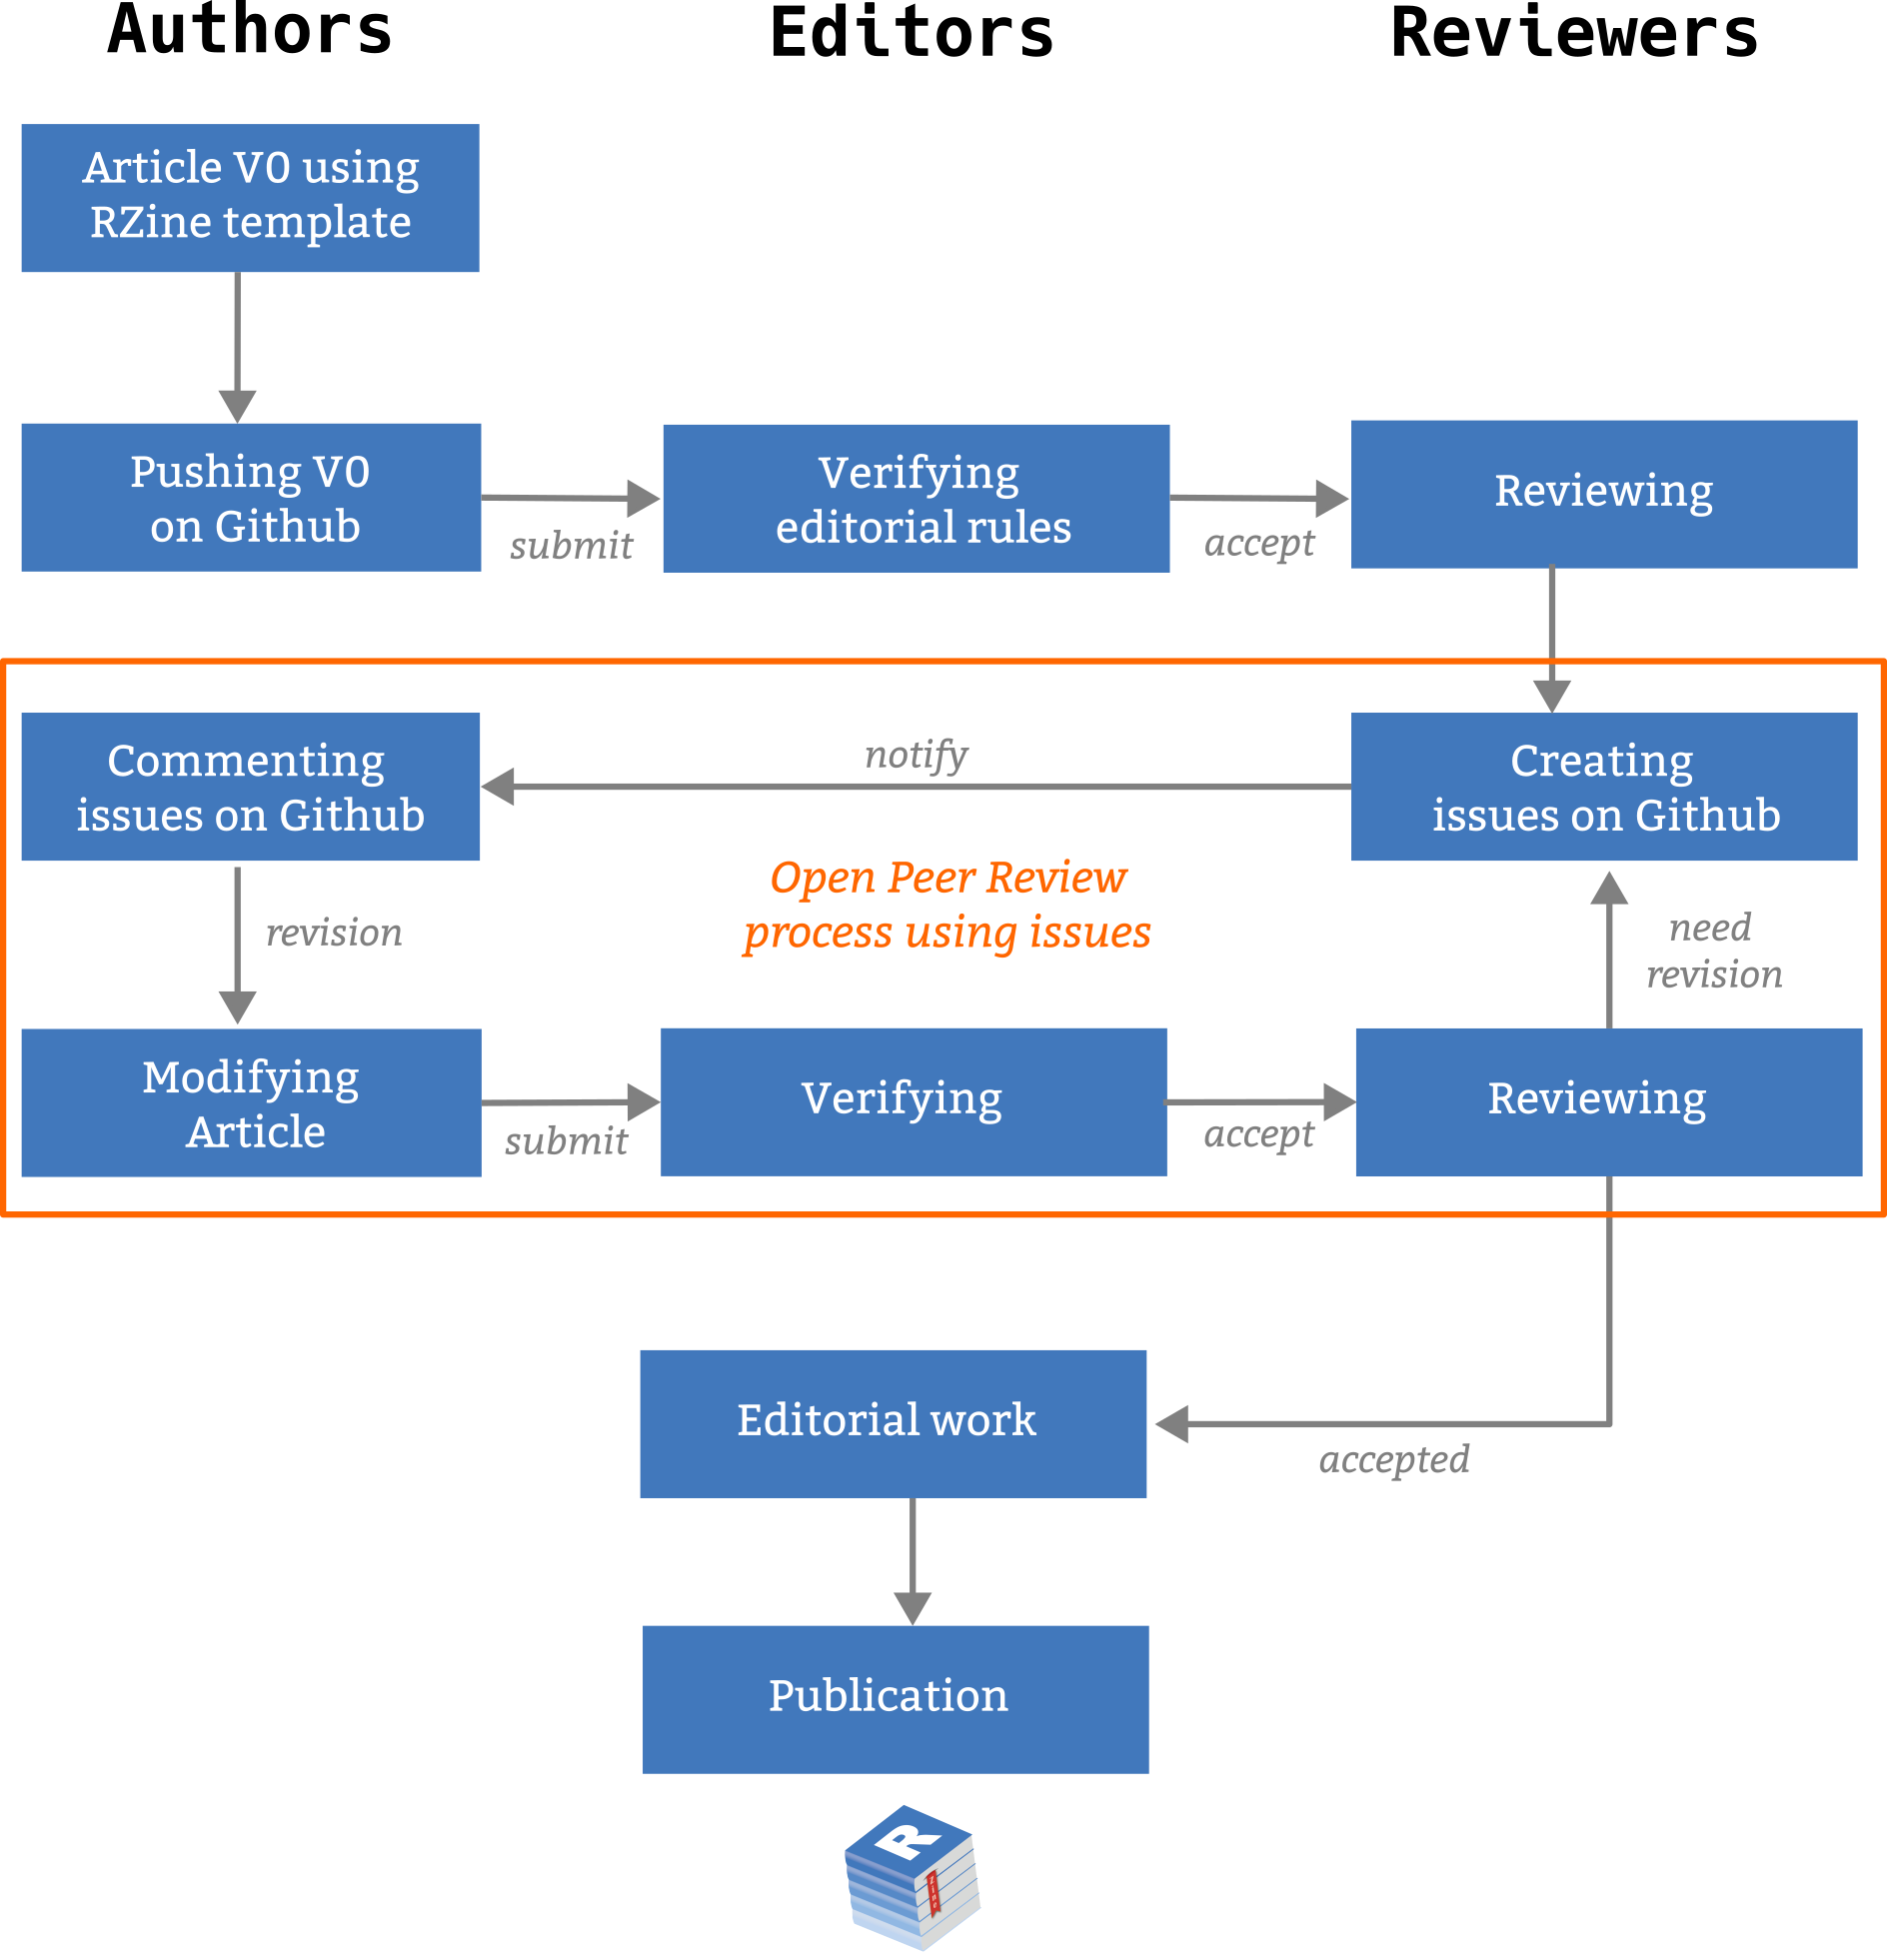
Editors’ point of view
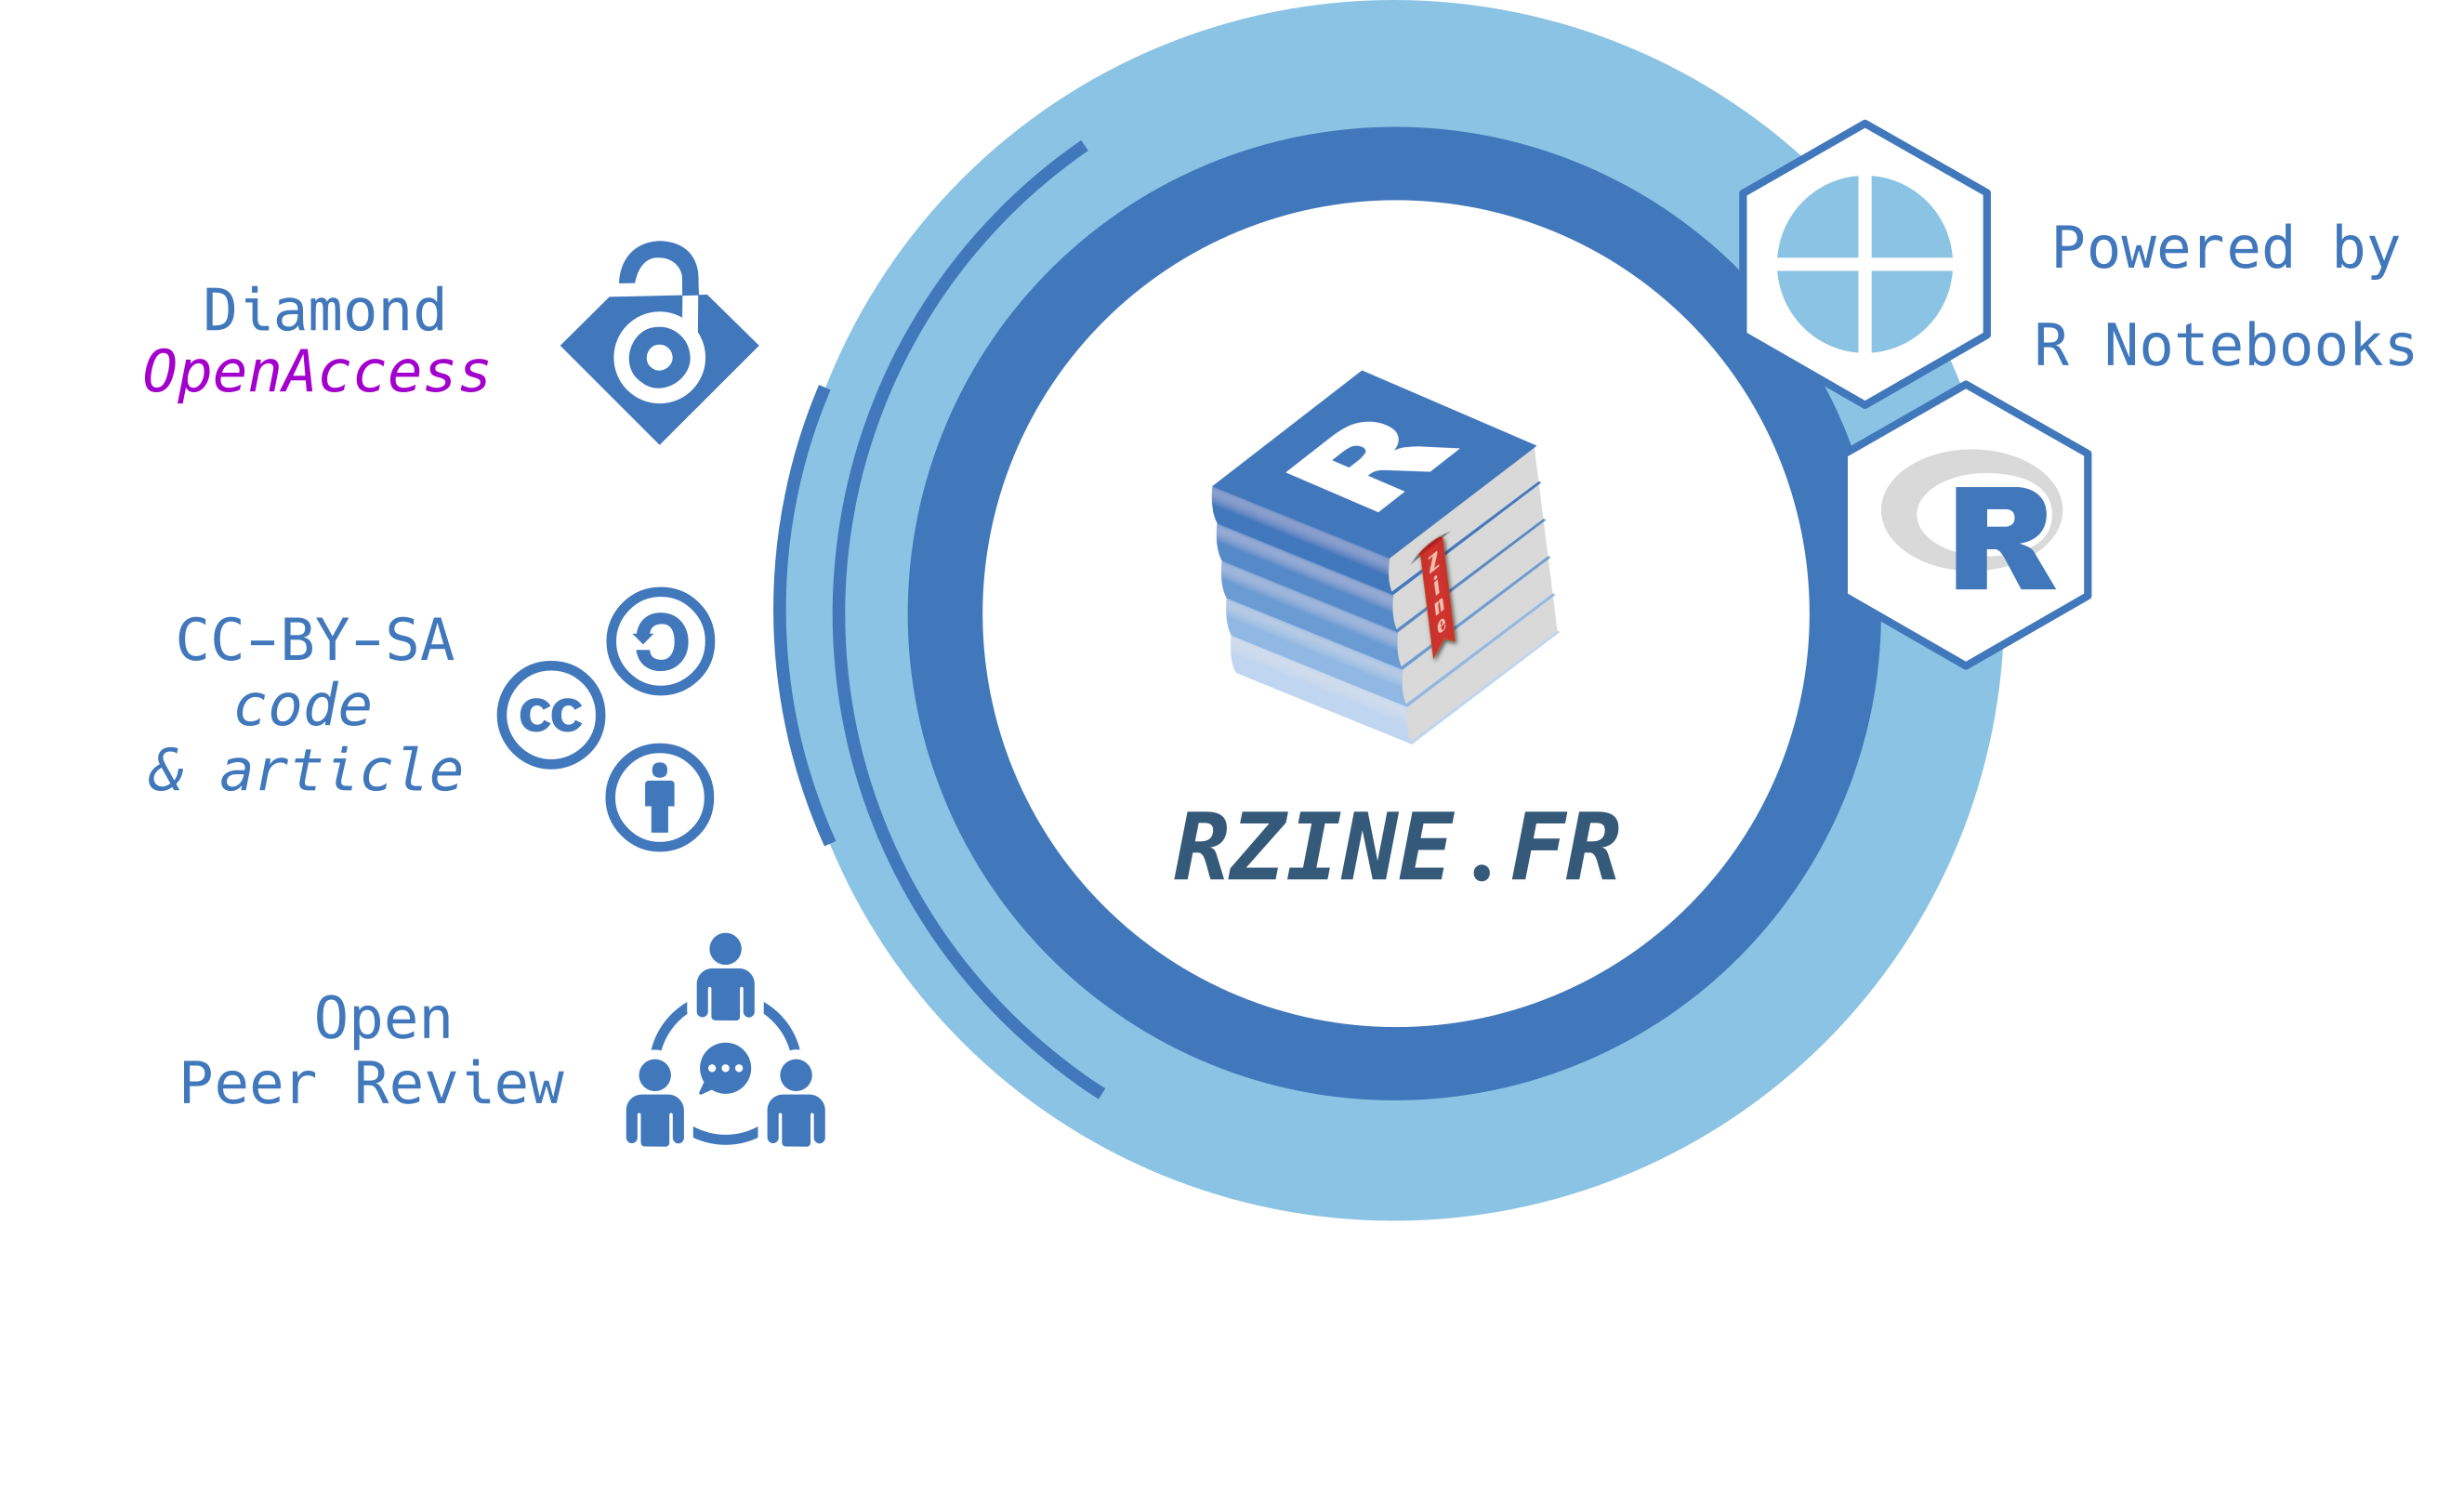
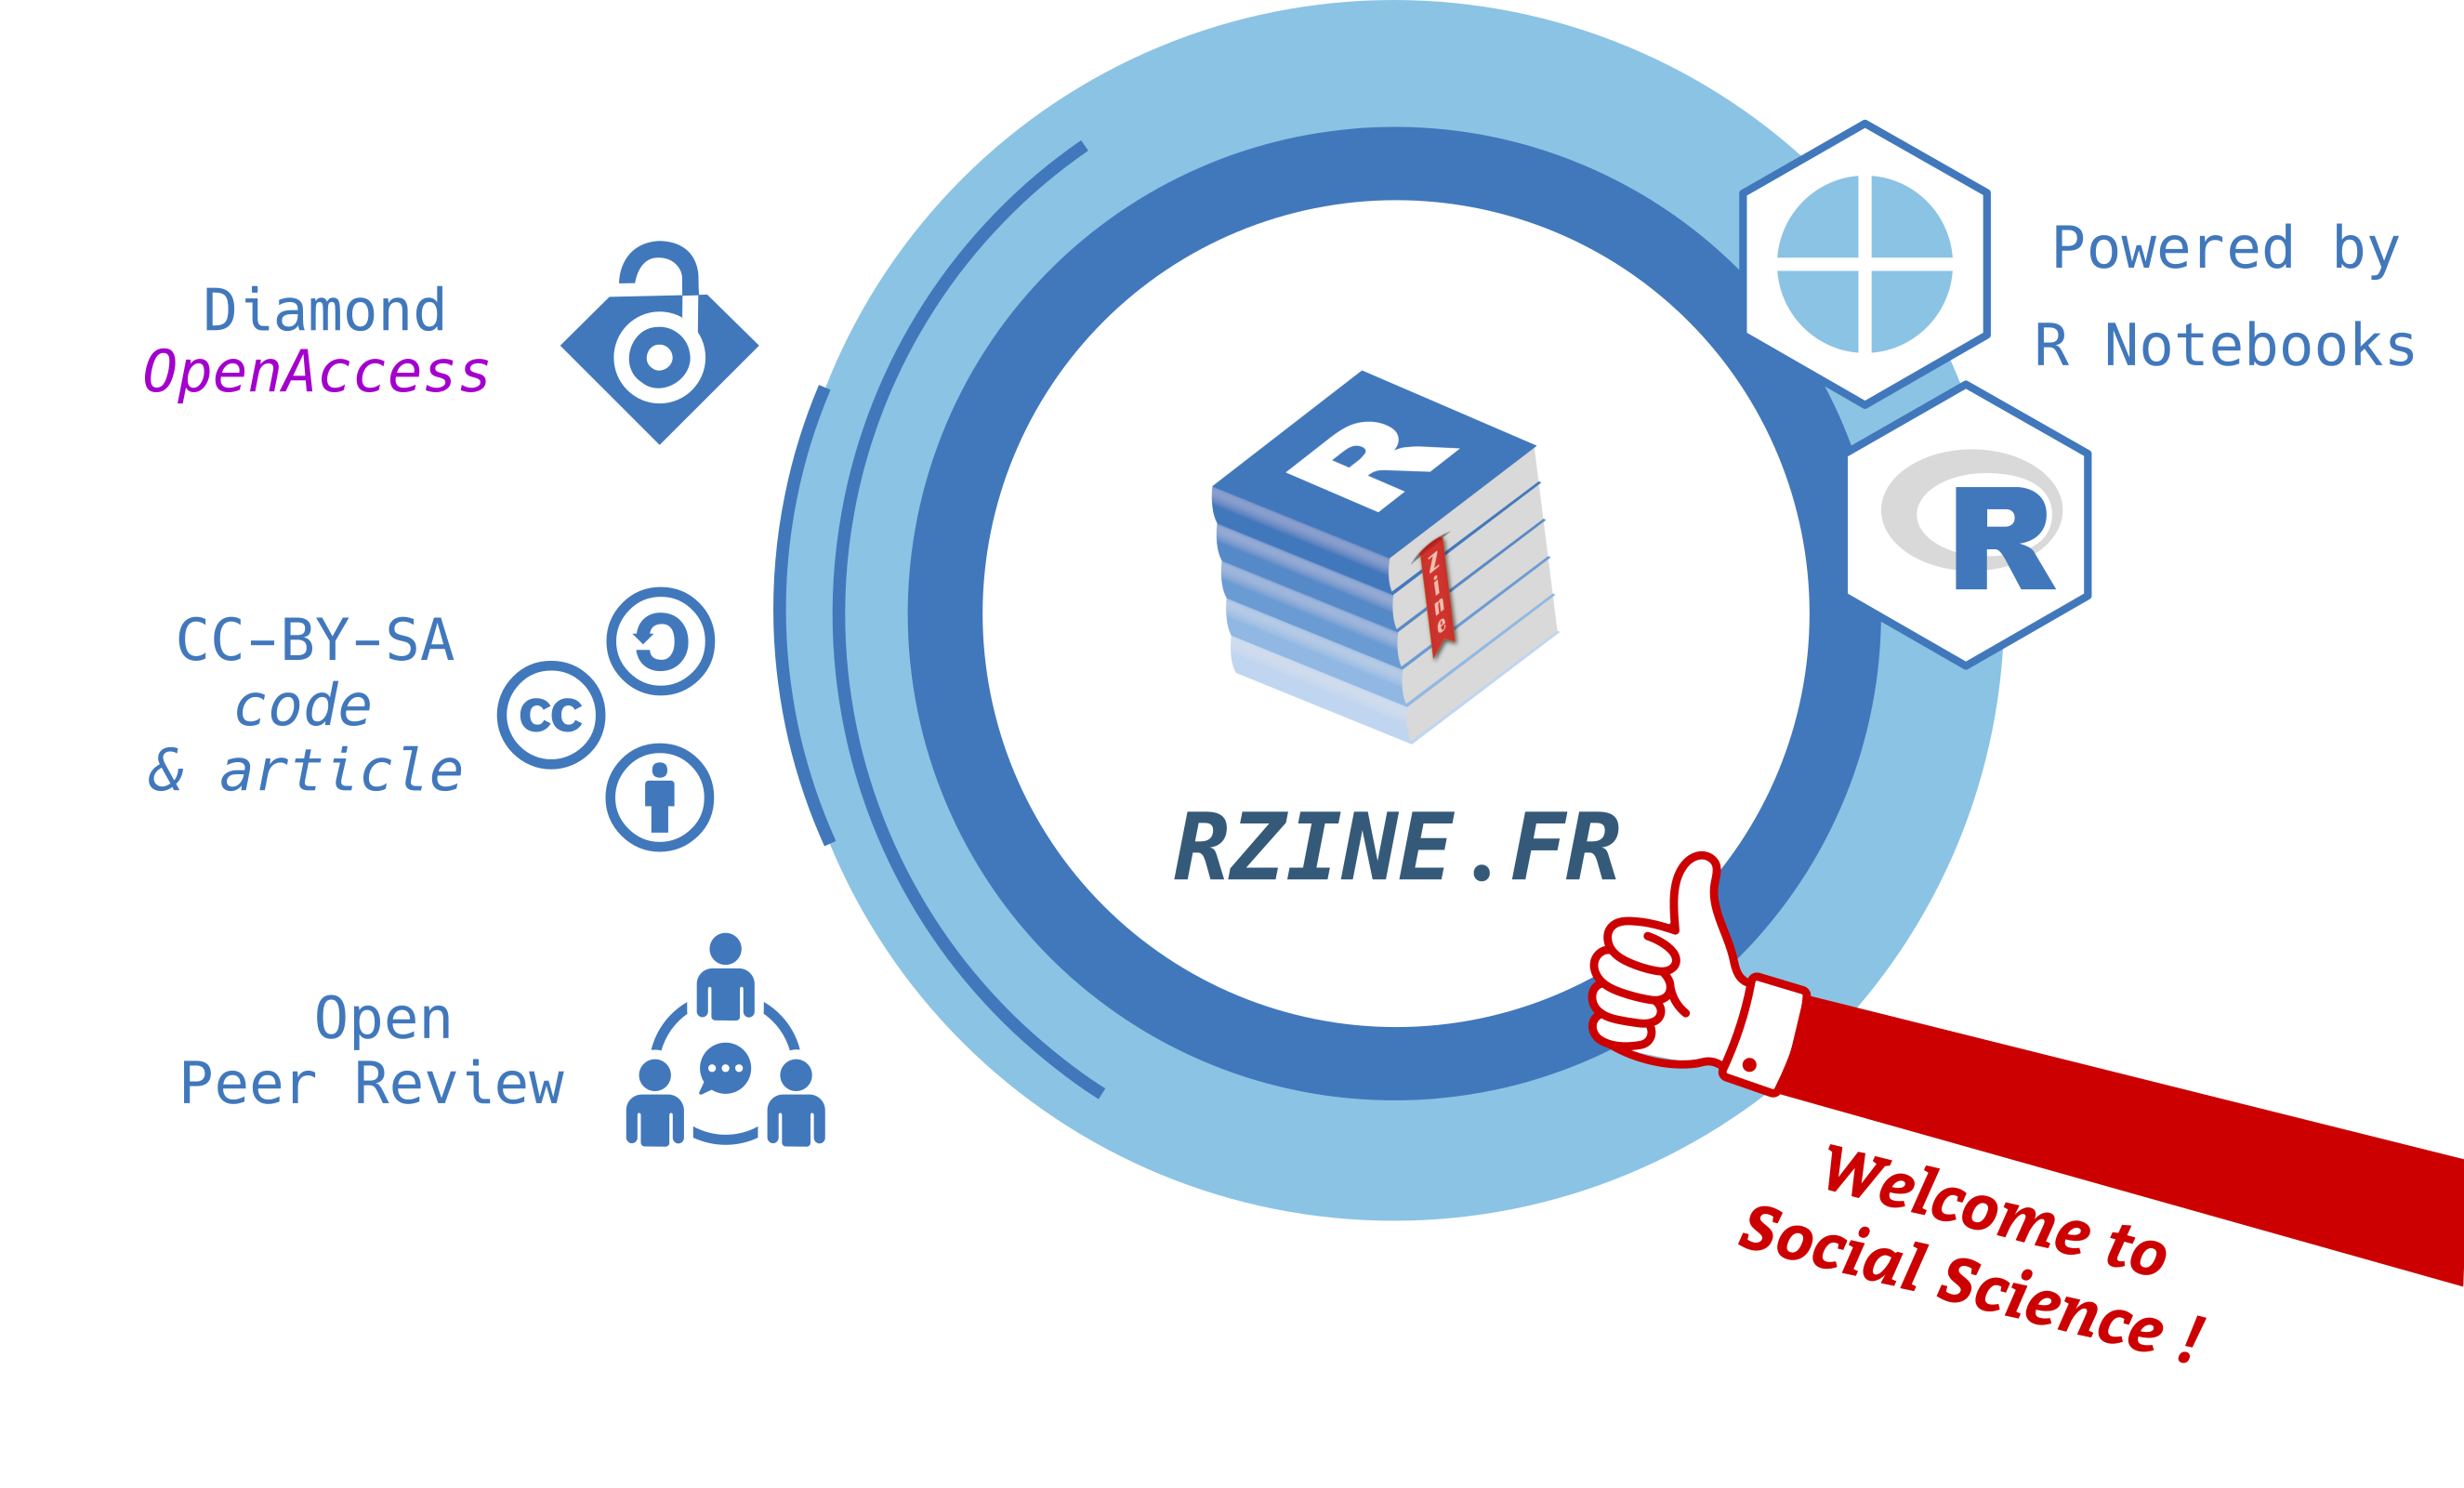
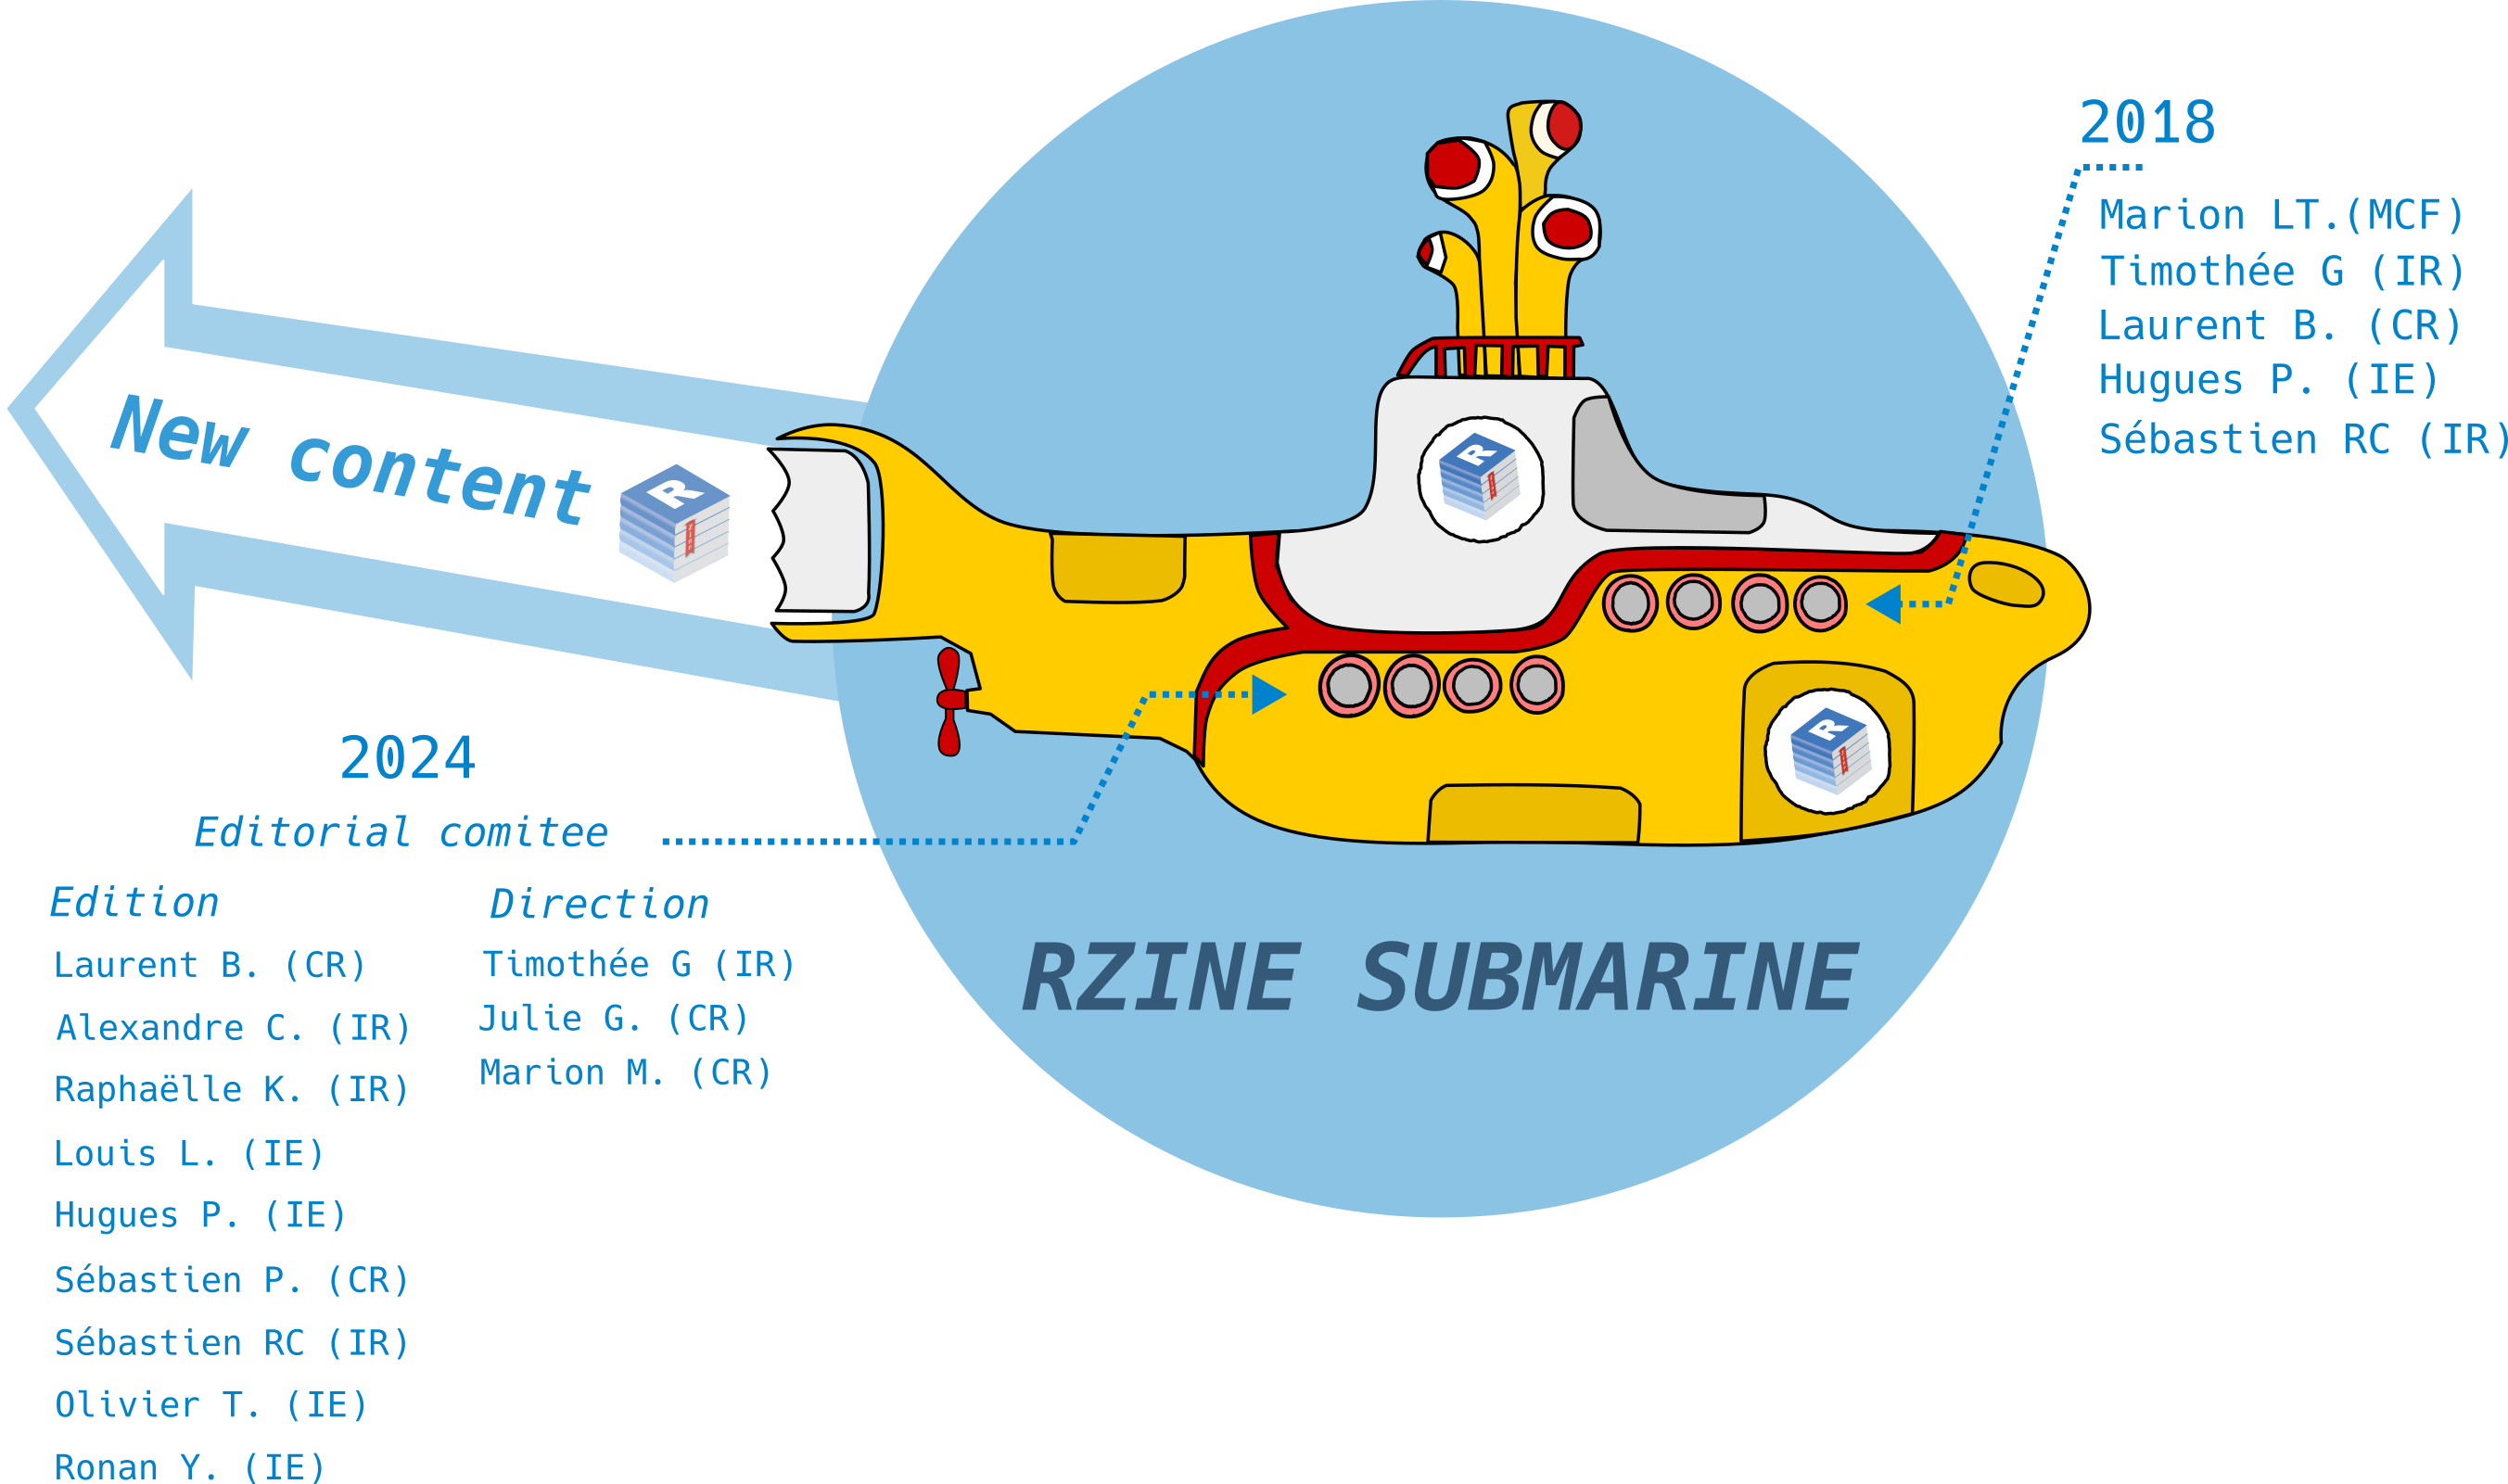
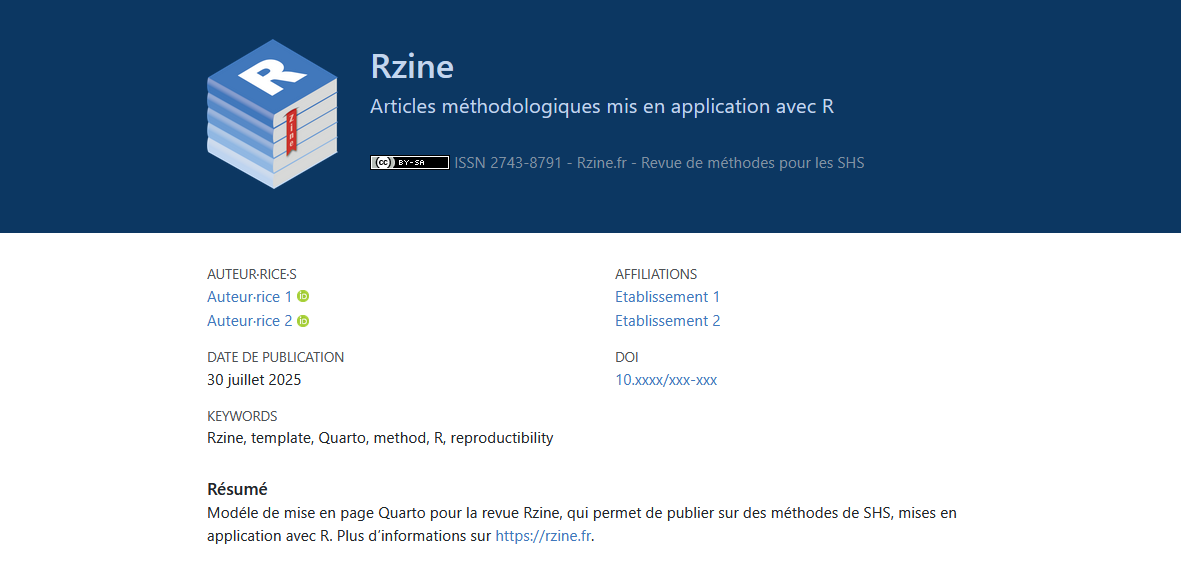
RZine in a Nutshell ?
RZine in a Nutshell ?
RZine objectives
Contribute to learning and practicing of R in Social Science,
Offering a new space and new tools for publication of methods,
Narrative, Data, Hermeneutics: the Journal of Digital History (35 mn)
international
academic
single blind peer-reviewed
open-access journal
Based on the principle of multilayered articles
The top layer could be a concise account of the subject, available perhaps in paperback. The next layer could contain expanded versions of different aspects of the argument, not arranged sequentially as in a narrative, but rather as self-contained units that feed into the topmost story. The third layer could be composed of documentation, possibly of different kinds, each set off by interpretative essays. A fourth layer might be theoretical or historiographical, with selections from previous scholarship and discussions of them. A fifth layer could be pedagogic, consisting of suggestions for classroom discussion and a model syllabus. And a sixth layer could contain readers’ reports, exchanges between the author and the editor, and letters from readers, who could provide a growing corpus of commentary as the book made its way through different groups of readers.
Robert Darnton, The New Age of the Book, The New York Review, 1999
Davis, Randall, Howard Shrobe, et Peter Szolovits. 1993. « What Is a KnowledgeRepresentation? »AI Magazine 14 (1): 17‑33. https://doi.org/10.1609/aimag.v14i1.1029.

 )
)